With low ridership, should Metro's huge excess cash pile go to flood control?
Today we have an excellent analytical guest post with some fantastic charts from Oscar Slotboom (highlights mine).
---
Metro's 2021 annual report, for the fiscal year ending September 30, recently became available.
Fiscal year 2021 is the first annual report entirely affected by Covid (see chart 1). As expected, metrics for ridership and cost per trip became much worse. However, more concerning are Metro's long-term trends prior to Covid, as the plots below will show.
In spite of ridership being cut in half due to Covid, Metro's financial position became stronger than ever due to a huge influx of federal grants, a total of $714 million in Covid relief in 2020 and 2021.

Chart 1: Fiscal year 2021 shown on the ridership trends. (Source: Metro ridership reports)
Data source for the charts is Metro's annual reports. Inflation adjustment uses the official CPI calculator.

Chart 2: Boardings and operating expense since 2001
The first impression from this chart is that both trends are going in the wrong direction! Prior to Covid-19, inflation-adjusted operating expense was up 77.5%, from $514.2 million in 2001 to $912.5 million in 2019, while ridership was down 11.7%. Ridership peaked in 2006 at 102.8 million boardings, and by 2012 had declined 21.2% due to the Great Recession. By 2016 ridership had recovered to 90 million boardings, down 12.5% from the peak, where it held steady until Covid-19. 2021 ridership of 45 million was down exactly 50% from 2019.

Chart 3: Cost, subsidy and average fare per boarding since 2001.
Of course, the cost per boarding goes up with rising operating expense and declining and/or flat ridership. Cost per boarding is calculated by (operating expense)/boardings, and subsidy per trip is (operating loss)/boardings. Prior to Covid-19, the cost per boarding in 2021 dollars was up 101%, from $5.05 in 2001 to $10.14 in 2019. The inflation-adjusted subsidy per boarding in the pre-Covid period rose 119%, from $4.27 in 2001 to $9.25 in 2019. In 2021 the cost per boarding was $17.57 and the subsidy per boarding was $16.98. Stated another way: in 2021 taxpayers handed over $16.98 every time someone stepped on a Metro bus or train.
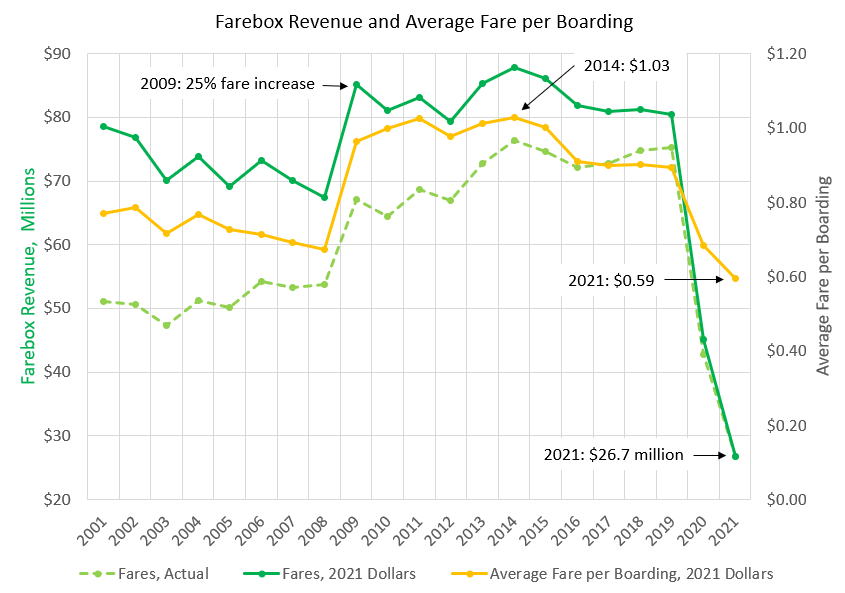
Chart 4: Total fare revenue and average fare per boarding since 2001.
Inflation-adjusted fare revenue was generally flat in the 11 years prior to Covid, varying between $79 and $88 million, with the average fare per boarding between $0.89 and $1.03. The base Metro fare is $1.25 but many riders qualify for discounts. In 2021, fare revenue dropped to $26.7 million and the average fare per boarding was $0.59.

Chart 5: Fare revenue as a percent of operational expense per boarding.
With fare revenue generally flat and operating expense increasing 77.5% between 2001 and 2019, the percent of operating expense covered by fares has steadily decreased. It was 15.3% in 2001, and then held steady around 12% from 2003 to 2014. (The increase in fares in 2009 was offset by increased operational expense per boarding due to the ridership decrease caused by the Great Recession.) The percent was flat around 9% from 2016 to 2019, and dropped to 3.4% in 2021.
This low farebox cost recovery was the reason Tory advocated consideration of eliminating fares entirely, which was subsequently studied by Metro but found to be infeasible. Metro recently approved spending $48.3 million to modernize its fare collection.

Chart 6: Major budget line items in 2021 dollars. Grants include both operational grants (such as Covid relief) and capital grants.
All previous plots were based on Metro's operating budget, but that's only part of Metro's overall budget, which includes infrastructure assistance (also called general mobility funding) and federal grants.
In this chart we can see that Metro received a massive financial windfall from federal Covid relief. 2020 farebox revenue was down $32.5 million compared to 2019, and Metro received $248.8 million in Covid relief. While Metro sustained some extra costs relating to Covid, the 2020 operating budget of $847.4 million was actually below the 2019 budget of $854.4 million. 2021 farebox revenue was down $48.6 million and Metro received a mind-boggling $465.6 million in Covid relief. The 2021 operating budget was $789.2 million, well below 2019 and 2020. The formulas for relief disbursement may have been designed for other cities which are more dependent on fares. Or, it was political payoff to Democratic-led large cities. Metro's 2021 total revenue of $1.425 billion shattered the previous record high of $1.279 billion (2021 dollars), which was unusually high due to grants for MetroRail expansion. Total revenue for 2021 was $636 million above the operating expense of $789 million. Of course, these excessively large payouts to transit agencies was piled on the $30 trillion national debt.

Chart 7: Infrastructure assistance
A major line item in Metro's budget is infrastructure assistance, which is also called general mobility funding. This budget feature has existed since 1988 and has returned around 25% of sales tax revenue to cities subject to Metro's 1% sales tax. These funds are used for streets and other infrastructure improvements. Infrastructure assistance fluctuates substantially year-by-year, as the chart shows, but has been in a general downward trend in the last 10 years, and was $187 million in 2021 which was 22.2% of sales tax revenue. This downward trend may be due to adjustments approved in 2012.

Chart 8: Metro employees
This chart shows the number of Metro employees, which has been between 3356 and 4106 in the last 20 years and had a noticeable upward trend in the 2010s. Metro had its lowest headcount of 3356 in 2006, the year of its peak ridership. Headcount in 2021 was 3848.
Observations
Most of us would like to see government steadily improve its efficiency and productivity. But in the case of public transit, the money flows in and gets spent, regardless of any performance metric. Prior to Covid, Metro's key metrics deteriorated due to both increased costs and generally flat/declining ridership (although there was an upward trend after the Great Recession ridership loss). And then Covid hit, totally wrecking performance metrics.
For context, it would be useful to compare Metro's statistics to comparable agencies such as Dallas, Phoenix or Atlanta. (That could be a topic for a future post.) We can easily compare Metro's operating expense to national averages reported by APTA, which publishes a spreadsheet which includes tab 73 reporting operating expense per unlinked passenger trip (i.e. a boarding). Metro's 2019 operating expense per boarding of $9.50 (actual value, not the inflation-adjusted $10.14 in the chart) is far above the industry average of $5.39 for bus, $5.14 for light rail and $5.20 overall. (It is not known if accounting standards are identical for the APTA and Metro numbers, and APTA numbers may be skewed by high-volume agencies like New York City.)
Public transit ridership was in a downward trend nearly everywhere in the 2010s, even in cities which were spending much more heavily on public transit. I recently reported that transit-focused Los Angeles sustained a 22% drop in ridership between 2013 and 2019. While Houston Metro ridership was better than most agencies in the 2010s, mainly due to the bus service improvement program, it appears to have been achieved at a high cost in increased boarding subsidies.
Improvement in key performance statistics of cost and subsidy per boarding is mostly dependent on a recovery in ridership, since government agencies generally don't shrink to match lower demand and Metro's spending may resume an upward trajectory due to MetroNext. So the question is: How much of the Covid-induced ridership loss can be recovered? How long will it take?
2021 ridership was down 50% compared to 2019. The first five months of fiscal year 2022 are running at about 55% of 2019, and there is an upward trend visible in chart 1, so getting back to 60% in FY 2022 is plausible. Metro is also better positioned than many transit agencies, since severely-hit commuter ridership was only around 12% of overall ridership and Houston's regional population growth is among the highest in the country. Looking at the recovery from the ridership loss caused by the Great Recession (see chart 2), there was a slow recovery which took six years, and the ridership plateau from 2016 to 2019 was 12.5% below the 2006 peak.

Chart 9: Possible range for future boarding subsidies for recovery scenarios
This plot shows some likely future scenarios. Since operating expense tracks sales tax revenue (reference chart 6), the medium option for sales tax revenue in the 2021 annual report page 20 is used to estimate the operating expense. A slow, 5-year recovery is assumed since transit ridership is recovering very slowly everywhere. Using estimated ridership recovery between 75% and 90% of 2019, the boarding subsidy is in the range of $12 to $15, compared to $9.25 in 2019 and $16.98 in 2021. Recovery to 85% of 2019 ridership, somewhat optimistic but plausible, has a subsidy around $13 per boarding in 2027. Note that there is no inflation adjustment on future values. Simple math dictates that getting back to the 2019 subsidy requires a 100% ridership recovery with the same operating expense, and lower ridership requires a lower operating expense.
Questions
- Was Metro's pre-Covid operating expense of $9.50 per boarding excessively high?
- What is a tolerable level for subsidy per boarding? Should Metro have a goal of getting it back below $10 per boarding? Or is a future range of $12 to $15 acceptable?
- If ridership is permanently reduced due to Covid and associated societal changes, mainly work-from-home and hybrid arrangements, should Metro operating budgets be lowered to match the actual ridership?
- In the last 10 years, boarding subsidies have been increasing and infrastructure assistance has been decreasing. Should infrastructure assistance continue in a downward trend, especially with the forecast of increasing sales tax receipts?
- Harris County is diverting hundreds of millions in toll funds to flood control, initially $300 million in 2020 and an expected $90 million per year in future years as part of the Harris County Flood Resilience Fund. Metro's current assets, basically cash and liquid investments, grew from $591 million in 2019 to $1.204 billion in 2021 (reference 2021 annual report page 82). Since Metro is swimming in money with its strongest financial position in its history, how about increasing infrastructure assistance (from sales tax receipts) with the incremental increase earmarked for flood control? (Tory: even if Metro is not legally allowed to directly fund flood control, they could fund City and County street infrastructure through increased infrastructure assistance/general mobility transfers so those entities could free up budgets for flood control while keeping overall street infrastructure budgets the same. It can certainly be argued that flood control is a much higher priority for the region than adding capacity to an already severely underutilized transit system!)
Appendix: Tabular data
This is the data used in the plots. Source is the annual reports. CPI=consumer price index inflation adjustment factor. CPI is for September of the year, to align with the end of the fiscal year.
| Operating Expense millions $ | Operating Loss millions $ | |||||
| Year | Boardings | CPI | Actual | 2021 Dollars | Actual | 2021 Dollars |
| 2001 | 101,914,157 | 1.538 | 334.3 | 514.2 | 282.8 | 434.8 |
| 2002 | 97,704,392 | 1.515 | 373.4 | 565.7 | 322.2 | 488.1 |
| 2003 | 97,740,511* | 1.481 | 395.6 | 585.9 | 348.3 | 515.8 |
| 2004 | 96,428,515 | 1.444 | 435.9 | 629.4 | 384.7 | 555.5 |
| 2005 | 94,959,198 | 1.379 | 430.4 | 593.5 | 380.3 | 524.4 |
| 2006 | 102,827,629 | 1.352 | 435.7 | 589.1 | 381.5 | 515.8 |
| 2007 | 101,310,353 | 1.316 | 459.6 | 604.8 | 406.4 | 534.8 |
| 2008 | 100,348,037 | 1.254 | 496.5 | 622.6 | 442.7 | 555.1 |
| 2009 | 88,517,657 | 1.270 | 558.6 | 709.4 | 491.5 | 624.2 |
| 2010 | 81,158,905 | 1.256 | 562.6 | 706.6 | 498.0 | 625.5 |
| 2011 | 81,032,075 | 1.209 | 570.5 | 689.7 | 501.8 | 606.7 |
| 2012 | 81,020,887 | 1.185 | 573.5 | 679.6 | 506.6 | 600.3 |
| 2013 | 84,266,386 | 1.172 | 591.9 | 693.7 | 519.1 | 608.4 |
| 2014 | 85,389,587 | 1.152 | 641.8 | 739.4 | 565.5 | 651.5 |
| 2015 | 86,089,171 | 1.153 | 694.8 | 801.1 | 620.1 | 715.0 |
| 2016 | 89,970,895 | 1.136 | 783.2 | 889.7 | 711.2 | 807.9 |
| 2017 | 89,940,735* | 1.111 | 807 | 896.6 | 734.2 | 815.7 |
| 2018 | 90,156,382 | 1.086 | 811.1 | 880.9 | 736.3 | 799.6 |
| 2019 | 89,951,217* | 1.068 | 854.4 | 912.5 | 779.0 | 832.0 |
| 2020 | 66,069,965 | 1.054 | 847.4 | 893.2 | 804.6 | 848.0 |
| 2021 | 44,914,325 | 1 | 789.2 | 789.2 | 762.5 | 762.5 |
Labels: infrastructure, Metro, pandemic, resilience, transit
posted by Max Concrete @ 4:56 PM
![]()
![]()


3 Comments:
It should go to repaying the money that the county took from HCTRA.
Right!? Totally agree.
Just because ridership temporarily dropped doesn't mean we should cut bus frequency. Cutting frequency would turn away riders even more because now they'll have to go back to planning their lives around the bus again. My opinion on Metro's "cash pile" is that metro should reinvest it in their own improvements. Transit that is separate from on street traffic is the holy Grail and can make taking transit comparable with driving.
Post a Comment
<< Home