Houston has less kludge and more opportunity, the value of mobility, and more
A few misc items this week:
Every planner should prominently post this quote in their office: “You can’t overestimate the value that mobility has on people’s quality of life and their ability to achieve their full economic potential.”
NYT: American Cities Have a Conversion Problem, and It’s Not Just Offices - Piles of regulations, or “kludge,” and a culture of “no” are limiting the ability to turn building blocks into something new. Houston's greatest advantage is that we have far less kludge than other cities - let's not squander it. Hat tip to George for the no-paywall link.
WSJ: ‘We Hold Our Breath’ Review: On the Banks of Buffalo Bayou - A brief account by a Houston native of the Texas city’s history, uncontrolled sprawl—and, above all, susceptibility to flooding. Hat tip to Tom. This one is less interesting for the book review itself than the comments on Houston:
"It is a great oasis of opportunity, especially for the immigrants, legal and otherwise, who end up there, stay, and prosper. There is a sizeable and successful Vietnamese population, Chinese too. The Hispanic community continues to grow and advance. A construction friend of mine once said, the new arrivals take any job because they can't speak English. Five years later they do and are foremen. In 10 they have their own company. Houston has a wealthy elite that gives unstintingly to its educational and cultural institutions and a great deal to its non-governmental help agencies. One I got to know helped released prisoners transition into work and careers with astonishing success statistics. Denominational schools like Corpus Christi and Strake Jesuit Strake do great work prepping minorities for college. The list goes on. And, Houston is resilient. It always rebuild, usually better."
"We are now retired in Austin (family ties) but despite its airs of superiority, Houston is better. It has what more of what I term real people not pretenders. The attractions there are better, museums, restaurants, entertainment, etc. Along with the real people, the sort of people I grew up and worked with."
“The answer for Houston, as in so many urban places imperiled by inadequate planning and a changing climate, seems to amount sadly to this: We hold our breath, and hope for the best.”
"For such a an awful place, it sure is curious how the Houston metropolitan area continues to be one of the fastest growing in the nation. Hmm. The real canard here is the foolish, unfounded belief that urban planning would make any difference when natural disasters occur. Urban planners are low rent civil servants whose livelihoods are dependent upon the largess of the politicians to whom they answer. The politicians, in turn, serve the greed of the rich and powerful, or respond to the ever changing whims of an ignorant populace. Who is to say which is worse? So, don’t pretend, for even an instant, that urban planning is a solution. Like central planning everywhere and every when, urban planning merely guarantees misallocation of capital and resources."
"Ah, the mystery of why people want to live in a city that is prospering, even though it hasn’t been adequately planned by experts in planning and is now susceptible to natural disasters like real hurricanes—unlike, say, New York City, where American zoning was invented but which, nevertheless, had to struggle through a “superstorm”."
"I look forward to reading the book; the review hits on many of the negatives of the city, it's hot, wet, sprawling, mosquitoes, snakes, etc... I'm a life long Houstonian, born and raised in the Bayou City, all those negative qualities do exist but people keep moving to the city. Why? The primary reason is opportunity. All of these opportunity seekers have a hard working, can do, personality, which gives Houston it's magic."
"Lived in Houston 30 years. Loved it! The Texas Medical Center is a treasure. The variety of restaurants and cross section of people from across the world is unequaled. No one cares where you came from, what school you attended who your parents were…just can you do the job. Houston is about “doing bidness”."
Access to Jobs: New Research on Driving and Transit
Readers of this newsletter may recall prior articles reporting on “access to jobs” studies carried out by researchers at the University of Minnesota. The broad conclusion of the series of studies is that in the 50 largest U.S. metro areas, a commuter can reach vastly more jobs in a given number of minutes via driving than by using transit. That is generally due to the dispersed locations of residences and employers. There is also a growing body of international research on the impact of journey-to-work time (or travel speed) on the economic productivity of metro areas.
I’m therefore pleased to report on a new working paper from the National Bureau of Economic Research that provides new findings on this subject. “More Roads or Public Transit: Insights from Measuring City-Center Accessibility,” by Lucas J. Conwell, Fabian Eckert, and Ahmed Mushfiq Mobarak was published in Jan. 2023 as NBER Working Paper 30877.
The authors’ innovation is to define “accessibility zones” surrounding the central business districts of the 109 largest U.S. and European cities. For each city, the study defined a set of car accessibility zones and transit accessibility zones. In keeping with established research on a metro area’s economic productivity, a premise of the study is that larger accessibility zones are associated with greater productivity. One broad finding is that compared with European cities, on average U.S. cities are twice as accessible by car as European cities, but are half as accessible by transit. This is obviously due to the much greater density of European metro areas compared with largely suburbanized America, and the corresponding differences in roadway networks and transit systems between the United States and Europe.
To simplify the modeling, the researchers divided commuting times into four groups: 0-to-15 minutes,16-to-30 minutes, 31-to-45 minutes, and 46-to-60 minutes. They defined the central business district (CBD) as the area with the highest economic productivity in the metro area and drew a 1-kilometer radius circle around the defined center. The median U.S. central business district accounted for 28% of all the employment within a 20-kilometer radius. They used Google Maps to construct the accessibility zones, using it to find the car or transit travel time to the CBD from any point in each land parcel. All the land parcels that enable a trip to the CBD in 15 minutes or less make up the 15-minute accessibility zone, and so on up to 60 minutes.
One of the most interesting results is that although Europe’s transit accessibility zones are all larger than those of the U.S., “car travel offers larger overall accessibility across all time distances in both Europe and the U.S.” And that means that “U.S. cities enjoy greater accessibility overall because they have a comparative advantage in car-based commutes.” One reason for this is that, especially for longer-distance commutes, transit provides only “patchy” access. By contrast, car commuters can use a comprehensive roadway network that directly connects every point A to every point B. But that does offer an advantage to bus transit over rail transit.
Although the authors mention in their introduction that larger accessibility (via more possible trips within a given time frame) leads to greater economic productivity, their paper does not attempt to quantify the potential economic benefits of U.S. cities’ much greater accessibility. They do briefly discuss the limited impact that could be expected from “densification” policies. And of course, they discuss how “US cities’ car orientation comes at the cost of less green space, more congestion, and worse health and pollution externalities.” Assuming vehicle electrification continues, the health and pollution impacts should decrease in the coming decades. Also, with greater use of road pricing, urban traffic congestion can be reduced.
While this study would be even more impressive with quantified economic productivity estimates, it should help transportation planners think through trade-offs between highways and transit in the coming decades.
Houston's mini-kaihatsu, sinking false alarm, annexation history, shrinking population, school choice, and more
Several smaller items this week:
Report: Houston is one of the fastest sinking cities on Earth, could 'disappear'. Let's check the math folks. Houston elevation is 79' = 2408cm. Losing 2cm/year x 100 years = -200cm. Sea level rise of 1cm every 5 years for 100y = 20cm. New elevation in 2122 = 2188cm, almost 72ft! Doesn't sound anywhere close to 'disappearing'...
Big NYT fail on road safety: the clear inflection point in the graph is the rise of distracting smartphones, yet they're NOT EVEN MENTIONED ONCE. Instead it's anti-car, anti-SUV, anti-speed, and anti-rideshare. All agenda instead of real problem-solving.
Kinder: Houston, Dallas led metro area growth in 2021 even as their urban cores lost population (news story, hat tip to Oscar). Harris County declining a bit even while the metro grows. I think a lot of people used the pandemic to move out to the nicer newer suburbs (commutes less of a worry in a remote work world), and the backfill immigration into the city wasn’t there as it usually is, especially from international immigrants. Crime spike hasn't helped either. Harris County really has to turn it around before we end up in the same place as Dallas County with significant outflows. Once people and employers flee, it’s a negative reinforcing cycle :-(
Book Review: The Making of Urban Japan, by Salim Furth. The review notes similarities between Tokyo's mini-kaihatsu (a dozen townhomes fronting a small alley) and similar developments in Houston:
Mini-kaihatsu, Houston
"The concept is the same, and it’s no coincidence that both arise in places with light regulation, strong demand, and little public streets funding. As I wrote about Houston:
Houstonians achieve privacy by orienting many new townhouses onto a share courtyard-driveway, sometimes gated, which creates an intermediate space between the private home and the public street…
The courtyard-driveways also provide a shared play space, as evidenced by frequent basketball hoops. Despite what Jane Jacobs may have told you, city streets are not viable play spaces for 21st-century children. But cul-de-sacs can be. Houston’s courtyard-and-grid model may be the ideal blend, unlocking the connectivity of a city while delivering the secure sociability of a cul-de-sac to a large share of homes."
With low ridership, should Metro's huge excess cash pile go to flood control?
Today we have an excellent analytical guest post with some fantastic charts from Oscar Slotboom (highlights mine).
---
Metro's 2021 annual report, for the fiscal year ending September 30, recently became available.
Fiscal year 2021 is the first annual report entirely affected by Covid (see chart 1). As expected, metrics for ridership and cost per trip became much worse. However, more concerning are Metro's long-term trends prior to Covid, as the plots below will show.
In spite of ridership being cut in half due to Covid, Metro's financial position became stronger than ever due to a huge influx of federal grants, a total of $714 million in Covid relief in 2020 and 2021.
Chart 1: Fiscal year 2021 shown on the ridership trends. (Source: Metro ridership reports)
Chart 2: Boardings and operating expense since 2001
The first impression from this chart is that both trends are going in the wrong direction! Prior to Covid-19, inflation-adjusted operating expense was up 77.5%, from $514.2 million in 2001 to $912.5 million in 2019, while ridership was down 11.7%. Ridership peaked in 2006 at 102.8 million boardings, and by 2012 had declined 21.2% due to the Great Recession. By 2016 ridership had recovered to 90 million boardings, down 12.5% from the peak, where it held steady until Covid-19. 2021 ridership of 45 million was down exactly 50% from 2019.
Chart 3: Cost, subsidy and average fare per boarding since 2001.
Of course, the cost per boarding goes up with rising operating expense and declining and/or flat ridership. Cost per boarding is calculated by (operating expense)/boardings, and subsidy per trip is (operating loss)/boardings. Prior to Covid-19, the cost per boarding in 2021 dollars was up 101%, from $5.05 in 2001 to $10.14 in 2019. The inflation-adjusted subsidy per boarding in the pre-Covid period rose 119%, from $4.27 in 2001 to $9.25 in 2019. In 2021 the cost per boarding was $17.57 and the subsidy per boarding was $16.98. Stated another way: in 2021 taxpayers handed over $16.98 every time someone stepped on a Metro bus or train.
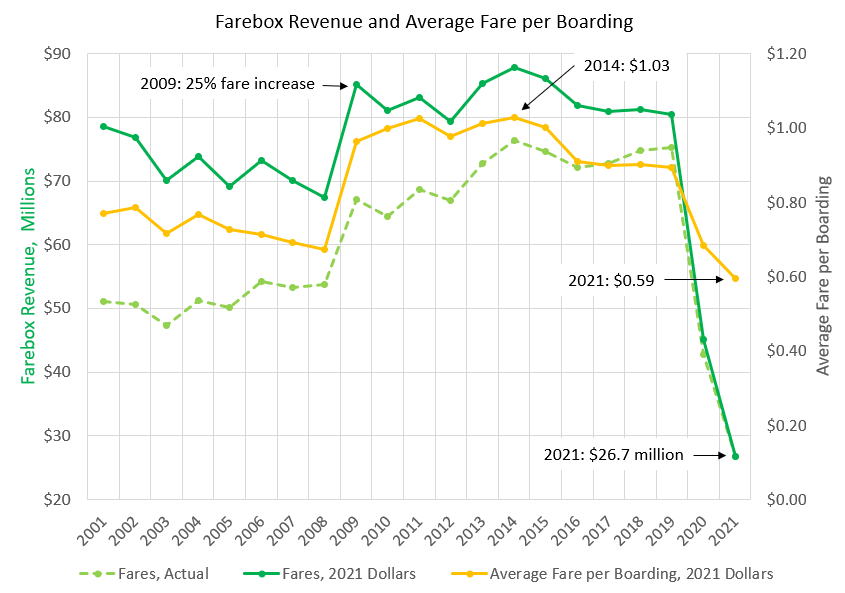
Chart 4: Total fare revenue and average fare per boarding since 2001.
Inflation-adjusted fare revenue was generally flat in the 11 years prior to Covid, varying between $79 and $88 million, with the average fare per boarding between $0.89 and $1.03. The base Metro fare is $1.25 but many riders qualify for discounts. In 2021, fare revenue dropped to $26.7 million and the average fare per boarding was $0.59.
Chart 5: Fare revenue as a percent of operational expense per boarding.
With fare revenue generally flat and operating expense increasing 77.5% between 2001 and 2019, the percent of operating expense covered by fares has steadily decreased. It was 15.3% in 2001, and then held steady around 12% from 2003 to 2014. (The increase in fares in 2009 was offset by increased operational expense per boarding due to the ridership decrease caused by the Great Recession.) The percent was flat around 9% from 2016 to 2019, and dropped to 3.4% in 2021.
This low farebox cost recovery was the reason Tory advocated consideration of eliminating fares entirely, which was subsequently studied by Metro but found to be infeasible. Metro recently approved spending $48.3 million to modernize its fare collection.
Chart 6: Major budget line items in 2021 dollars. Grants include both operational grants (such as Covid relief) and capital grants.
All previous plots were based on Metro's operating budget, but that's only part of Metro's overall budget, which includes infrastructure assistance (also called general mobility funding) and federal grants.
In this chart we can see that Metro received a massive financial windfall from federal Covid relief. 2020 farebox revenue was down $32.5 million compared to 2019, and Metro received $248.8 million in Covid relief. While Metro sustained some extra costs relating to Covid, the 2020 operating budget of $847.4 million was actually below the 2019 budget of $854.4 million. 2021 farebox revenue was down $48.6 million and Metro received a mind-boggling $465.6 million in Covid relief. The 2021 operating budget was $789.2 million, well below 2019 and 2020. The formulas for relief disbursement may have been designed for other cities which are more dependent on fares. Or, it was political payoff to Democratic-led large cities. Metro's 2021 total revenue of $1.425 billion shattered the previous record high of $1.279 billion (2021 dollars), which was unusually high due to grants for MetroRail expansion. Total revenue for 2021 was $636 million above the operating expense of $789 million. Of course, these excessively large payouts to transit agencies was piled on the $30 trillion national debt.
Chart 7: Infrastructure assistance
A major line item in Metro's budget is infrastructure assistance, which is also called general mobility funding. This budget feature has existed since 1988 and has returned around 25% of sales tax revenue to cities subject to Metro's 1% sales tax. These funds are used for streets and other infrastructure improvements. Infrastructure assistance fluctuates substantially year-by-year, as the chart shows, but has been in a general downward trend in the last 10 years, and was $187 million in 2021 which was 22.2% of sales tax revenue. This downward trend may be due to adjustments approved in 2012.
Chart 8: Metro employees
This chart shows the number of Metro employees, which has been between 3356 and 4106 in the last 20 years and had a noticeable upward trend in the 2010s. Metro had its lowest headcount of 3356 in 2006, the year of its peak ridership. Headcount in 2021 was 3848.
Observations
Most of us would like to see government steadily improve its efficiency and productivity. But in the case of public transit, the money flows in and gets spent, regardless of any performance metric. Prior to Covid, Metro's key metrics deteriorated due to both increased costs and generally flat/declining ridership (although there was an upward trend after the Great Recession ridership loss). And then Covid hit, totally wrecking performance metrics.
For context, it would be useful to compare Metro's statistics to comparable agencies such as Dallas, Phoenix or Atlanta. (That could be a topic for a future post.) We can easily compare Metro's operating expense to national averages reported by APTA, which publishes a spreadsheet which includes tab 73 reporting operating expense per unlinked passenger trip (i.e. a boarding). Metro's 2019 operating expense per boarding of $9.50 (actual value, not the inflation-adjusted $10.14 in the chart) is far above the industry average of $5.39 for bus, $5.14 for light rail and $5.20 overall. (It is not known if accounting standards are identical for the APTA and Metro numbers, and APTA numbers may be skewed by high-volume agencies like New York City.)
Public transit ridership was in a downward trend nearly everywhere in the 2010s, even in cities which were spending much more heavily on public transit. I recently reported that transit-focused Los Angeles sustained a 22% drop in ridership between 2013 and 2019. While Houston Metro ridership was better than most agencies in the 2010s, mainly due to the bus service improvement program, it appears to have been achieved at a high cost in increased boarding subsidies.
Improvement in key performance statistics of cost and subsidy per boarding is mostly dependent on a recovery in ridership, since government agencies generally don't shrink to match lower demand and Metro's spending may resume an upward trajectory due to MetroNext. So the question is: How much of the Covid-induced ridership loss can be recovered? How long will it take?
2021 ridership was down 50% compared to 2019. The first five months of fiscal year 2022 are running at about 55% of 2019, and there is an upward trend visible in chart 1, so getting back to 60% in FY 2022 is plausible. Metro is also better positioned than many transit agencies, since severely-hit commuter ridership was only around 12% of overall ridership and Houston's regional population growth is among the highest in the country. Looking at the recovery from the ridership loss caused by the Great Recession (see chart 2), there was a slow recovery which took six years, and the ridership plateau from 2016 to 2019 was 12.5% below the 2006 peak.
Chart 9: Possible range for future boarding subsidies for recovery scenarios
This plot shows some likely future scenarios. Since operating expense tracks sales tax revenue (reference chart 6), the medium option for sales tax revenue in the 2021 annual report page 20 is used to estimate the operating expense. A slow, 5-year recovery is assumed since transit ridership is recovering very slowly everywhere. Using estimated ridership recovery between 75% and 90% of 2019, the boarding subsidy is in the range of $12 to $15, compared to $9.25 in 2019 and $16.98 in 2021. Recovery to 85% of 2019 ridership, somewhat optimistic but plausible, has a subsidy around $13 per boarding in 2027. Note that there is no inflation adjustment on future values. Simple math dictates that getting back to the 2019 subsidy requires a 100% ridership recovery with the same operating expense, and lower ridership requires a lower operating expense.
Questions
Was Metro's pre-Covid operating expense of $9.50 per boarding excessively high?
What is a tolerable level for subsidy per boarding? Should Metro have a goal of getting it back below $10 per boarding? Or is a future range of $12 to $15 acceptable?
If ridership is permanently reduced due to Covid and associated societal changes, mainly work-from-home and hybrid arrangements, should Metro operating budgets be lowered to match the actual ridership?
In the last 10 years, boarding subsidies have been increasing and infrastructure assistance has been decreasing. Should infrastructure assistance continue in a downward trend, especially with the forecast of increasing sales tax receipts?
Harris County is diverting hundreds of millions in toll funds to flood control, initially $300 million in 2020 and an expected $90 million per year in future years as part of the Harris County Flood Resilience Fund. Metro's current assets, basically cash and liquid investments, grew from $591 million in 2019 to $1.204 billion in 2021 (reference 2021 annual report page 82). Since Metro is swimming in money with its strongest financial position in its history, how about increasing infrastructure assistance (from sales tax receipts) with the incremental increase earmarked for flood control? (Tory: even if Metro is not legally allowed to directly fund flood control, they could fund City and County street infrastructure through increased infrastructure assistance/general mobility transfers so those entities could free up budgets for flood control while keeping overall street infrastructure budgets the same. It can certainly be argued that flood control is a much higher priority for the region than adding capacity to an already severely underutilized transit system!)
Appendix: Tabular data
This is the data used in the plots. Source is the annual reports. CPI=consumer price index inflation adjustment factor. CPI is for September of the year, to align with the end of the fiscal year.
Operating Expense millions $
Operating Loss millions $
Year
Boardings
CPI
Actual
2021 Dollars
Actual
2021 Dollars
2001
101,914,157
1.538
334.3
514.2
282.8
434.8
2002
97,704,392
1.515
373.4
565.7
322.2
488.1
2003
97,740,511*
1.481
395.6
585.9
348.3
515.8
2004
96,428,515
1.444
435.9
629.4
384.7
555.5
2005
94,959,198
1.379
430.4
593.5
380.3
524.4
2006
102,827,629
1.352
435.7
589.1
381.5
515.8
2007
101,310,353
1.316
459.6
604.8
406.4
534.8
2008
100,348,037
1.254
496.5
622.6
442.7
555.1
2009
88,517,657
1.270
558.6
709.4
491.5
624.2
2010
81,158,905
1.256
562.6
706.6
498.0
625.5
2011
81,032,075
1.209
570.5
689.7
501.8
606.7
2012
81,020,887
1.185
573.5
679.6
506.6
600.3
2013
84,266,386
1.172
591.9
693.7
519.1
608.4
2014
85,389,587
1.152
641.8
739.4
565.5
651.5
2015
86,089,171
1.153
694.8
801.1
620.1
715.0
2016
89,970,895
1.136
783.2
889.7
711.2
807.9
2017
89,940,735*
1.111
807
896.6
734.2
815.7
2018
90,156,382
1.086
811.1
880.9
736.3
799.6
2019
89,951,217*
1.068
854.4
912.5
779.0
832.0
2020
66,069,965
1.054
847.4
893.2
804.6
848.0
2021
44,914,325
1
789.2
789.2
762.5
762.5
*Discrepancy in values in different years of annual reports. Discrepancies are small and don't affect plots.
A really steep toll increase for 288, and this is where my “I told you so” kicks in: they should have made it 4 lanes one-way inbound in the mornings and outbound in the evenings to match demand, instead of 2x2.
"As a result of the region’s booming population, Houston tops the list of major U.S. metro areas with the most construction permits issued for single-family homes from 2012 through 2021, according to new data from self-storage marketplace StorageCafe. During that period, 392,136 permits for single-family homes were handed out in the region.
“Houston has been the primary destination for newcomers moving to Texas, especially Californians who find respite in Harris County’s lower home prices and tax rates, cheaper land, and sound economy,” StorageCafe says in explaining the demand for more homes in the area.
From 2012 through 2021, Houston also led the country’s 50 biggest metros for new retail space (more than 51.8 million square feet). Here’s how Houston ranks in other segments for newly built commercial real estate:
Third for new office space (nearly 44.3 million square feet).
Third for new self-storage space (nearly 17.6 million square feet).
Fourth for multifamily construction permits (170,817).
Fourth for new industrial space (more than 153.3 million square feet).
Houston ranks second for construction activity across all six property types from 2012 through 2021.
"Cities have historically been the gateway to America and our nation’s promise of opportunity and upward mobility. Today, however, many of our nation’s highest profile cities have become ‘luxury products’ affordable only for the highest income earners. Houston and other ‘opportunity cities’ have historically bucked this trend by embracing policies that lower the cost of living, create jobs, and enhance the quality of life for all. But a continuation of this success is under threat from an array of proposed ‘command and control’ policies that will erode our city’s dynamism. Houston’s success is no accident, and it’s future is worth fighting for.
Join the Liberty Leadership Council and the Urban Reform Institute for a vibrant discussion of Houston’s market-centered, ‘people-oriented’ approach to urban policy, planning, and development.
We’ll talk zoning, transportation, infrastructure, housing, and everything in between—all while enjoying views of downtown and toasting the Bayou City."
City Journal: End of the Road for Parking Requirements - They serve as a tax on housing. Houston should pass a plan to automatically reduce parking minimums citywide by 8%/year - enough for real impact over time w/o public blowback. Why keep building parking that autonomous taxis will make obsolete in the 2030s or even sooner?
"Texas is already known for high econ freedom and autonomy from the feds. The more I learn, the more unique it seems on this front. Counties without zoning. Toll roads galore. Limited land handed to the feds. Independent not unified school districts. Separate energy grid. Higher speed limits. And I could go on. The governance here is truly different.
A culture of exceptionalism: Texas wants to be the best, and has built an unapologetic brand around it - “everything’s bigger in Texas.” Coastal urban America used to have that bravado, but is now overcome with Nimbyism and guilt-mongering."
Forbes: Miami Just Rolled Out Its Newest Red Carpet To The Tech World. Are San Francisco And Austin Paying Attention? Hat tip to Judah. I’d heard about the Miami tech push (I think their odds are better getting Wall Street). The REEF model is an interesting one, although probably not for Houston. It seems to be taking advantage of tight zoning in most cities to create new locations for businesses using parking lots, because those businesses can’t find a real location in certain neighborhoods. Houston’s lack of zoning means real locations are readily available in most areas.
"More permits (48,208) were issued last year for new-home construction in the Houston area than anywhere else in the U.S. DFW ranked second (43,884), and Austin held the No. 5 spot (21,653)."
Drive & Listen: Wow this is super cool and mesmerizing. You can set the speed of the vehicle, street noise, music - even change radio stations while driving in 50 different cities around the world, spending as much time as you like in any one of them. Someone needs to do this for Houston!
Finally, we'll end with a little dark humor meme that makes a great point:
Ever-growing layers of bureaucracy are how societies stagnate, and it's the direct cause of increasing unaffordability in cities across the country.
One more lead item so the blog lives up to its name this week ;-) Assuming the River Oaks Theater won't be taken over by a live theater group (really the best option), my suggested best realistic option in a streaming world: since Weingarten wants another high-rise there, preserve and repurpose it as a cool public lobby and coffee bar, marquee and all. Sure it's sad to lose the actual movie theater, but does that have any chance when you can stream pretty much any independent film at home any time?
Moving on to lots of backlogged items to catch up on this week:
Dallas insanity: $1.7 billion for 2.4 miles of mostly subway. That's $708 million per mile! Glad Houston METRO is being a lot more pragmatic and prudent with their resources than this. Hat tip to Oscar.
Antiplanner on Reinventing the Jetliner (i.e. high speed rail) with some compelling opening paragraphs:
"Suppose I told you that I have reinvented the jet airliners that carried Americans more than 750 billion passenger miles–about 10 percent of all passenger travel–in 2019. My reinvented jet will go less than half as fast as existing jets. It will cost six times as much to operate, per passenger mile, as existing jets. Unlike existing jets, which can go anywhere there is air, the reinvented jet will only be able to go on a limited number of fixed routes.
This wondrous invention will become a reality if the federal government spends a mere one, two, or possibly three or four trillion dollars. Does that sound like a good deal? No? Yet that is exactly what high-speed rail advocates are proposing. Some proposals, such as the Green New Deal, even call for almost completely replacing low-cost, fast jet airliners with high-cost, relatively slow trains."
Now on an opportunity cost basis, just imagine if those trillions went directly into carbon reduction instead of white elephant high-speed rail lines??
"Less than 50 percent of people who worked in Manhattan offices in 2019 will be working from those offices in the coming years, according to a recent survey by the Partnership for New York City."
"One thing I always admired about Houston is how confidently immigrants claim public space for themselves—how working families picnic in Hermann Park or elated quinceañeras roam the Galleria with their brightly attired entourages and pose for portraits before the Waterwall."
Which relates to this good news for Houston: "Among his clients, more than half now cite diversity as a top criterion when choosing new locations"
I keep reading how Houston is losing its affordability and median home prices have gone up 34% since 2010, but isn't that just 3% per year (compounded), slightly above inflation?
Joel Kotkin: The death of the American city - Rising crime and a pandemic-inspired exodus are powering urban decay. Great quote:
"Cities do not thrive by having more cutting-edge coffee shops, trendy restaurants and edgy boutiques; they need safe streets, decent schools and jobs for middle and working-class families."
This week we have an excellent guest post by Jim Crump on the hot topic of the moment: fixing Texas' electric grid so the winter storm failures don't happen again.
Regulation of Electric Power in Texas
Politicians, pundits, and the public at large have voiced deep concern that electricity was tragically unavailable to many Texans during the recent period of extreme cold. Claims that lax ERCOT planning caused the problem are exaggerated. “Grid independence” from federal regulation is manageable. The problem lies in the supervisory structure that regulates the Electricity Reliability Council of Texas (ERCOT) - Texas’ Public Utility Commission (PUC), a three-member panel appointed by the state legislature, and our elected officials, ultimate guardians of the public interest.
To start, claims that ERCOT’s planning process is undisciplined are misleading. Published documents (December 2020, January 2021) evidence well-structured scenario planning of capacity, demand, and reserve margin, including grid requirements and fuel types. True, evolving events brought conditions not premised in these studies but laxness is an unwarranted criticism.
The next layer of electric power management: Oversight of ERCOT by the PUC. Here, critical commentary by knowledgeable observers is valid. To begin with, independent management of Texas’ power grid – that is, independent of the Federal Energy Regulatory Commission (FERC) – rests on reasonable logic, not merely the fabled secessionist tendencies of Texans.
Two conditions in combination make Texas electrically unique. First, the ERCOT grid embraces abundant energy resources as well as large urban demand centers, thus the energy system within ERCOT’s reach can self-supply. (“Supply” goes beyond fossil sources. The barren mesa region of west Texas is reliably windy.) Next, the grid’s regional limits follow state lines to a high degree; the political boundaries of Texas align with grid infrastructure, El Paso and portions of the panhandle and east Texas excepted. The first condition (grid independence) allows supply without power purchase from other states, hence authority to operate free from regulation by the Federal Energy Regulatory Commission (FERC); the second facilitates rule-making and goal-setting, from the state legislature to PUC to ERCOT.
Results of FERC-independent behavior are subject to debate; certainly positive outcomes can be offered. ERCOT’s market-based model coupled with strong transmission infrastructure linking generation to consumers have enabled rapid growth of competitively-priced electricity sourcing, most recently wind generation and prospectively, solar. ERCOT’s fuel mix report states that wind plus solar accounted for more than 20% of generated electricity in 2020.
However, specific policies of a perhaps lenient regulatory framework appear unwise and call for revision. A large proportion of winter electricity supply anticipated by ERCOT was disabled by frigid weather because established standards for deep-cold winterization had not been implemented. In televised appearances Bill Magness (ERCOT CEO) and Dan Woodfin (Director, System Operations) explained that such standards are provided to generators on an advisory basis, not mandated.
Also, ERCOT manages generation adequacy by pricing methodology, which failed in this severe case. Reserve capacity, like winterization, may require measures beyond market-based methods (a mandate). Of course, bulking up reserve capacity alone would be inadequate in the absence of stricter winterization. Backup generators incapable of startup would have been of no help to Texans in the cold light of dawn on February 15.
Clearer, more aggressive communication to the public might have saved untold damage and pain. Meaningful public advisories that could have helped Texans to safeguard property (and life) were late and limited. Future communication protocols must require updates on rotating or extended blackouts, health and safety information, and practical advice to prevent freezing of water systems.
So, a call to our governor, legislators and PUTC commissioners: Draw yourselves up to full stature, recognize that Texans’ lives are at stake, and formulate firm guidelines (yes, non-market guidelines where necessary) on winterization, reserve capacity, communication, and other requirements that will flow from the public hearings that Dan Phelan, speaker of the Texas House, has so sternly announced. You must put right the executive functions linking our legislature to the PUC and to ERCOT.
Texans suffered due to physical climate conditions, here a word on the political climate. Both major parties must acknowledge shared responsibility for past power decisions. Democrats: Recognize that efforts to decouple Texas from FERC originated when democrats controlling Texas politics acted to shield Texas companies from federal regulators.
Republicans: Abandon the failed narrative that renewables caused the shortage – this is nonsense. Abandon also the impulse to label renewables as menacingly “liberal”, therefore unworthy of service to the lone star state. For one thing, such pronouncements violate the market basis for electricity sourcing that you claim to champion. Recall also that Senator Chuck Grassley of Iowa, a Republican, is justly regarded by many as the father of wind energy – at least, father of legislative enactment of the wind operating tax credit, a spur to the growth of wind generation.
Our leaders must tame their rhetoric, mandate best operating practices, and modify market-defined guidelines where required to protect Texans.
Hope you emerged from this crazy winter storm + power/water outage week relatively unscathed. I certainly learned the value of stockpiling water and draining water pipes (esp. with a power outage), and ERCOT learned that it's a bad idea to cut off power to natural gas pumps across the state during a winter storm. I hope they spend a bit of time doing analysis before jumping to expensive solutions like full winterization of all facilities. It's possible that if they had simply mapped natural gas pumps and compressors across the state and treated them as critical non-blackout facilities like hospitals, we might have gotten away with short-duration rolling blackouts that would have been far more manageable (like 2011).
"Solutions will have to be nuanced and incremental. Winterizing all power plants would be unnecessarily expensive, and so would a complete overhaul of Texas' market design, which is partly responsible for consistently low power prices compared with the rest of the country."
And an excellent idea: "One option could be rewarding liquefied natural-gas processing facilities in Texas to both curtail electricity usage and to redirect the feedstock natural gas for electricity rather than for exports."
"to equal the 80 Bcf/d of gas delivered during cold snaps, the U.S. would need an electric grid as large as all existing generation in the country, which is currently about 1.2 terawatts."
Unpopular observation: gas-powered cars, trucks, and SUVs were a critical source of resilience during this never-ending mass power-outage disaster by providing heat and recharging. If we all had electric vehicles, this disaster would have been epically worse. A hard truth.
"Grant Ruckel, vice president of government affairs at pipeline company Energy Transfer, testified that the biggest failure during the disaster was cutting power to gas pipelines, many of which are not listed as essential services, a designation made for hospitals and other critical infrastructure." ...
"Deshotel said he had asked generators how many plants would have gone down if they hadn’t lost gas pressure, and the answer was only a couple."
How a Biden presidency can boost Houston, plus the cause of our growth, how LA is like us, Montrose is dead, and a graffiti artist guide to visiting HTX video
A lot of people are probably thinking about a Biden presidency as a negative for the oil industry and Houston, but there are some potential silver linings here. A big one would be a massive federal infrastructure investment bill that could dramatically improve Houston's flood resilience, including the Ike Dike and Galveston Bay Park surge barriers (great overview video). Another would be reopening international migration, which has been a big booster for Houston in the past (and has been significantly suppressed since 2016).
But the biggest potential boost would be the oil industry giving him a viable alternative to the Green New Deal. Instead of banning fracking or federal drilling permits - which just imports more oil from the Middle East - how about a tariff on imported oil to boost local jobs while also reducing carbon emissions? (by keeping prices up) Could the industry give him cover to get it passed and popular with the public? How about channeling the industry into something it has the expertise, infrastructure, and capital to do very, very well: carbon sequestration? (i.e. injecting it into the ground) How about encouraging LNG exports to Europe to give them an alternative to coal and Russian natural gas? Or LNG exports to China to displace the massive coal plants they're building there? There are so many ways the oil industry could be part of the solution on carbon, if they would just engage in good faith.
Moving on to some smaller items this week:
Market Urbanist Scott Beyer at the Foundation for Economic Education: What's the Cause of Houston's Growth?For decades, Houston has been the nation’s leading example of an “opportunity city.”
"If America had a more market-oriented urban approach, those aspects of Houston—the density and affordability—would be the ones most likely replicated. For this reason, “getting a bunch of Houstons” should be an urbanist goal."
Los Angeles: a city that outgrew its masterplan. Thank God. In the first of our regular series of dispatches from around the world, this longtime LA resident argues that his city's endless variety should be a key part any new metropolis's design. Sounds a lot like Houston. Hat tip to George.
"The very lack of defined form and cultural tradition here, the statelessness of the city itself or those who live in it, allows for a distinctive type of vitality that I've felt nowhere else."
Finally, I'll end with a fun video: Houston by a Local - Travel Tips for Houston - A Day in Houston, Texas. Discover Houston with a local: Graffiti artist Gonzo 247 shows you highlights of his home town in the U.S. state of Texas. One of them is Space Center Houston. Hat tip to George.
My HBJ piece on NZ adopting TX MUDs, Techxodus, video on Houston's identity, future of offices, HTX developments in 2021, Stack City, rich zip codes, and more
"Harris, the most populous county in fast-growing Texas with 4.7 million people, went to six zip codes on this year’s list from just one last year." ...
"Almost half of the richest zip codes, 49 of the 100, are in just seven counties: Manhattan & suburban Westchester County in NY, Connecticut’s Fairfield County, Chicago’s Cook County, California’s LA & Santa Clara counties, & Houston’s Harris County (6)."
Techxodus: The flight of terrified techies from California to Texas marks the end of one era, and the beginning of a new one
"Travel is a part of our lives. Instead of treating it like a cost, we should embrace it, using it to enhance our economic and social well beings. To the extent that government is involved in transportation, instead of trying to limit travel it should do what it can to enable it and to extend the benefits of travel to as many people as possible."
“There are a number of examples of the Texas-style stack in and around our larger metropolitan areas, including Houston, which, because of its large number of stack interchanges, is known as “Stack City””
My first time hearing that nickname - curious to hear in the comments if others have come across it before?
NYT: The Future of Offices When Workers Have a Choice (archive link) - Some work spaces in central employment districts may become housing, and some housing in residential areas may become work spaces. My prediction is that managers will try to get people back to the office, but it will be very bumpy (not everybody vaccinated, virus continues to circulate at a low level, employers sued by employees that get sick, people unhappy with returning to commute), and talent will start looking for employers that don’t require the commute, even a day or two a week. Also companies will find they can access much more affordable remote talent globally, and those companies will start winning vs. companies constraining themselves to limited, expensive local talent pools. Key excerpt:
“Even before the pandemic, there were signs of trouble with the office market in the handful of cities where the “creative class” had been flocking. In 2018, net migration to New York, Los Angeles and San Francisco was negative, while the U.S. economy grew at a healthy 2.9 percent. Creative magnets like London and Paris were experiencing similar declines.
The explanation for the declines — mostly high housing costs because of severe limits on new construction — obscures other forces that were destabilizing the traditional office market. In the middle of the 2010s, Amazon, Facebook, Google, Apple and others started splitting their headquarters into multiple locations. Stripe, one of the world’s most valuable start-ups, went a step further. In 2019, it “opened” a remote hub, hoping to “tap the 99.74 percent of talented engineers living outside the metro areas of our first four hubs” in San Francisco, Seattle, Dublin and Singapore.
For the fastest-growing companies, being able to tap into talent anywhere became more important than having all their teams in one place. Smaller cities were good enough. In retrospect, this shouldn’t have been a surprise, despite all the talk about the importance of giant, dense labor markets to fuel innovation. After all, Silicon Valley itself is not a city but a cluster of sprawling towns scattered along a highway.
The defining characteristic of this new version of the creative class may not be where it lives, but its ability to live anywhere it wants. Put differently, people move to certain cities in search of better-paying jobs, but it’s now possible to earn high (if not the highest) salaries from almost anywhere. That has been true in certain smaller cities in recent years (Austin and Denver in the United States, for example, and Manchester and Leeds in Britain). To a lesser extent, it has also been true for people who chose not to live in cities at all.”
Bloomberg's Case for Moving to Houston (but not a city for the soft), URI-COU 2020 year in review video, HTX youth, TX #1 growth, and more
Happy new year everyone. Hope you enjoyed the holidays and the recent amazing weather (while staying safe). A lot of you probably had out-of-town family and/or friends visiting. Next time nonlocal friends or family say Houston is too hot, floods too often, or gets too many hurricanes, here's my recommended reaction: politely agree with them that Houston is not a city for the soft or irresilient - they should probably choose somewhere like California. Texas welcomes the tough.
"Consider Phyllis Njoroge, who grew up in Massachusetts. After graduating from Tufts University in 2019 with a degree in cognitive and brain science, she started making spreadsheets of places in the U.S. that had a warm climate, were diverse, and had a reasonable cost of living.Houston won out, and she moved there in March"
...
Having more remote workers means “wages in Texas are going up,” he says. So are housing prices. “You can’t have a $2 million, 2,000-square-foot house in San Francisco and a $200,000 house in Dallas that are basically the same for very long when there are airplanes and internet connections and Zoom.”
"I simply say, “no, please don’t be sorry. I love living in Houston. It’s a great place to live and I have a great life there. It’s actually not that place that you might imagine it to be. In fact, it’s one of the country’s most ethnically diverse and progressive cities. My children go to school with kids from all over the world. And the wine and food scene there is great, too.”
A better alternative to channelizing Buffalo Bayou, VC leaving CA for TX, top life science and entrepreneurship rankings, big solar, and more
My lead item this week is my proposed alternative to channelizing Buffalo Bayou or an expensive tunnel to better drain the westside reservoirs and avoid a future Harvey flooding tragedy: a 27-mile drainage trench or pipeline(s) using power-line right-of-way, satellite mapped here. I got inspired after reading Jim Blackburn's Chronicle interview about how bad the Army Corps of Engineers study was. And if a trench is problematic for some reason, maybe giant pipelines like these could work for a small fraction of the cost of a bored tunnel? Or the trench could be covered? Would genuinely love to hear feedback in the comments on the feasibility of this from people more knowledgeable than I...
"Houston is on track to be a top market for life sciences. The report factored in size and growth of life-sciences employment, venture capital and National Institutes of Health funding, and more."
WSJ: California, Love It and Leave It - Bad policy has made the state unlivable, so I moved my family and my venture-capital firm to Texas.
"California’s restrictive zoning laws make it nearly impossible for many essential low- and middle-income workers to live anywhere near major cities. In Texas, permissive zoning allows every member of our staff to live close to work and spend time with friends and family instead of enduring grueling commutes."
An open dialogue on serious strategies for making Houston a better city, as well as a coalition-builder to make them happen. All comments, email, and support welcome.