The best posts from the first 20 years and 2.3 million pageviews
Today is the 20th (!) birthday of Houston Strategies with our 1,412th post. It's hard to believe that two decades have passed since I started this blog, and it's been an incredible journey. It seems like just yesterday we were celebrating 1.5 million pageviews at the 15-year mark. Obviously things have slowed down a bit in recent years (this is my first post of 2025, lol). In honor of this milestone, I've decided to update my best posts from the first 15 years - which is now five years out-of-date - by pulling from my annual highlights posts. As you skim this list, I hope you find some of interest that you missed, forgot, or may have been posted before you discovered Houston Strategies. Enjoy.
For those of you a little put off by the old-style webpage design, I should take this opportunity to mention again that it is sort of stuck, and that's because I have a legacy blogspot template that can't be upgraded to a newer design without either a lot of work outside my expertise or losing my archive of old posts. One of the penalties for being an early blogger, lol. Hope you don't mind the old format. I'm kinda assuming the content matters more to my readers than a slick modern design ;-)
Reflections and Looking Ahead
Reaching 20 years and 2.3 million pageviews is a significant milestone for Houston Strategies. It's a testament to the power of ideas and the importance of ongoing dialogue about how we shape Houston. As I reflect on the past two decades, I'm filled with gratitude for the readers who have joined me on this journey. Your engagement, feedback, and support have been invaluable.
Houston Strategies will continue to explore the ever-evolving landscape of urban planning in the Opportunity City, seeking innovative solutions to the challenges facing Houston and advocating for policies that create a better and more vibrant city. Here's to the next chapter!
As always, thanks for your readership.
-Tory
Top posts and big ideas from the last five years15 absolute all-time favorites from the first 15 years- A new brand identity for Houston: Houspitality
- MaX Lanes: A Next-Generation Strategy for Affordable Proximity
- MetroNext's bold moonshot opportunity
- Elements of an Opportunity City
- Ten years of Houston Strategies retrospective
- Maximizing Opportunity Urbanism with Robin Hood Planning (COU White Paper)
- How Opportunity Urbanism can save the global economy (Part 1, Part 2)
- The Ultimate Houston Strategy
- Seizing the Astrodome opportunity to establish Houston's new global identity
- My TEDx Houston talk, mostly about Houston (a summary of some of my better ideas from this blog)
- A Pragmatic Approach to Houston’s Future (part 1, part 2)
- A Map to Houston’s World-Class Future (part 1, part 2)
- Architects vs. Economists (the planning vs. free-market spectrum)
- Applying Jane Jacobs' 4 tenets of vibrant neighborhoods to car-based cities (mobility/draw-zones for vibrancy)
- Why does Houston have such a great restaurant scene?
I also want to acknowledge Oscar Slotboom's deeply analytical and wonderfully insightful guest posts over the last few years:
Thank you again!
Labels: economic strategy, highlights, identity, MaX Lanes, Metro, mobility strategies, opportunity urbanism
Next big moonshot for Houston? TX will pass CA and HTX will pass LA, auto vs. transit job access and realism
A few smaller misc items this week:
- Texas will surpass California, and both DFW and Houston will pass LA in population over the next 40 years. "The American future seems to be more Lone Star State than a Golden one."
- Houston Public Media/NPR asks "What could be the next big moonshot for Houston?" Among the answers, clean energy struck me as the most ambitious and most appropriate for Houston (ideally cost-effective carbon capture!). My own suggestion for a Houston moonshot? METRO could aspire to offer half-hour or less express trip times from every park-and-ride and transit center to every major job center and both airports using a network of MaX Lanes. A high goal but very achievable and it would support Houston's growth for decades to come. More on it here.
- New Geography: Auto vs. transit job access ratios for the top 50 metro areas (hat tip to Bill). Essentially comparing how many jobs are accessible by car within 30 mins (the typical commute) vs. by transit. A Houstonian can access 97.3 times (!) as many jobs by car than by transit within the same commute time. Even in NYC with excellent transit a car can still reach 9.7 more jobs than transit in the same time. The conclusion is compelling:
Where for Transit from Here?
With this minimal transit use relative to the auto and especially in view of the huge transit market share losses since the pandemic, it would seem useful to rethink the role of transit.
Transit does well for work trips to the largest downtown niche markets (New York, Chicago, Philadelphia, Boston, Washington, and San Francisco), though pre-pandemic market shares are unlikely to be replicated in the future because of the popularity of hybrid and remote work, lower office occupancy and the likely improvement in virtual meeting technology.
The reality is that transit is not a substitute for the auto and there isn’t enough money to make it one. Professor Jean-Claude Ziv and I found that making the auto a genuine alternative to transit could be prohibitively costly, annually requiring the entire metropolitan area gross domestic product in some cases. This would leave nothing else for anything else.
It would be foolhardy to suggest that transit is an alternative to the auto (despite this having sbeen implied by federal, state, and local policy for decades of decline), In a non-utopian world, no reasonable increase in subsidies could make it so.
It may be best to identify the small areas within metro areas where transit could actually be an alternative to auto. This would be in neighborhoods where automobile ownership is particularly low, which, in most metros are also areas of greater economic need. Investing billions more to coax middle class commuters off the roads seems a daft approach given the realities.
Labels: census, growth, MaX Lanes, Metro, mobility strategies, perspectives, transit
TX Transportation Update - legislature, projects, NHHIP, Inner Katy MaX lanes, Austin should convert rail to BRT
This week we have an excellent detailed update on multiple Texas transportation projects from Oscar Slotboom (bold highlights mine). ---
Texas Legislature
The regular session ended on Memorial Day. Transportation-related issues were mostly low priority, and the Senate focused mainly on a few important long-term funding bills.
Houston-specific issues (no bills passed):
- SB 2515 would have required HCTRA to use its revenue for road improvements only, but the bill made no progress after introduction. SB 1727, signed into law in 2021, placed some restrictions on the ability of Harris County to harvest toll money for non-transportation purposes. Generally speaking, the legislature had little interest in toll issues, passing only two minor bills relating to billing and preparation for icy conditions.
- Texas Central high-speed rail received much less attention than in previous sessions, with only three bills filed and none making much progress. With Texas Central moribund, the project opposition did not put effort into anti-project bills.
Bills approved (statewide):
Three bills provide long-term funding for TxDOT into the early 2040s. This is especially important since recent inflation has extended project timelines, with
NHHIP now scheduled for completion in 2042.
-
HB 2230 extends Proposition 1, which provides funding from surplus money in the rainy day fund. Amount is variable depending on oil prices, and is usually $1 to 2 billion per year. Expiration is extended 8 years from 2035 to 2043.
-
SCR 2 extends proposition 7, which provides $2.5 billion plus a percent of auto sales tax each year. The $2.5 billion is extended 10 years to 2042, and the auto sales tax funding is extended 10 years to 2039.
-
SB 505 imposes a $200 annual road use fee on electric vehicles, in recognition that electric cars don't pay any fuel tax for road maintenance. Although this will generate a small amount of revenue in the near term, it could become a substantial revenue source in the future.
-
HB 3297 ends vehicle safety inspections on December 31, 2024. But emissions testing will continue, so in Houston we still need to take our cars to a testing center.
Inner Katy Managed Lanes
In May I provided an
update on the status of the Metro's Inner Katy (Loop 610 to downtown) BRT. A TxDOT
presentation on May 18 says that construction on the separate managed lanes could begin in 2026 or 2027 (page 19). This is good news! However, there is much work still to be done, including environmental clearance, so 2026-2027 seems optimistic. There is not yet a recommended design option, but all the
documents suggest that an elevated structure in the center of the freeway is the leading candidate. Future public meetings will influence the recommended design. The scope of the project includes reconstructing the main lanes and increasing the minimum vertical clearance to 18.5 feet. (It is currently around 15'4"). This will be an expensive project.
Big Projects in Dallas and Austin move ahead of NHHIP
While NHHIP has been engulfed in controversy,
the $1 billion I-345 project in Dallas and the $5 billion I-35 project in Austin are moving forward and are now scheduled to be completed much sooner than NHHIP, even though planning for both the Dallas and Austin projects started much later than NHHIP. Dallas City Council recently
unanimously approved TxDOT's plans to sink the elevated I-345 freeway into a trench. The DEIS for I-35 in Austin was released in February and TxDOT is moving toward
construction as fast as possible.
While there has been plenty of controversy for both the Dallas and Austin projects, local officials did not file lawsuits or request federal reviews.
| Project |
Planning Started |
Work Starts |
Scheduled completion |
| NHHIP |
2004
2010 detailed |
2025 |
2042 |
| I-35 Austin |
2013 preliminary
2020 detailed |
2026* |
2032* |
| Dallas I-345 |
2016 preliminary, 2020 detailed |
2028 or 2029* |
soonest 2033 |
*Schedule tentative and subject to change.
So if I-35 and I-345 continue to progress as expected, they will be completed in 2032 or 2033. Only three small sections of NHHIP are
scheduled to be complete at that time (including I-69 south of I-45, and the I-10/I-45 interchange). The vast majority of work including downtown work and all of I-45 north of downtown would be just getting started or not even started.
Austin's New Plan for Light Rail
In April 2022 Austin's original light rail
plan including a subway was estimated to cost $10.3 billion, with the
tunnels costing around $1 billion per mile. Those estimates were before recent severe inflation in construction costs.
Austin's revised
plan (
map with data) is now entirely at street level, running in the middle of streets just like Houston's MetroRail. Depictions of the new plan look very familiar to Houstonians. Costs, however, remain outrageously expensive.
- 9.8 miles, all at street level, taking away traffic lanes
For comparison, Metro rail is 23 miles, all at street level, and Dallas has a 93-mile system mostly on dedicated right-of-way including a subway
- Project cost: $4.5 to $4.8 billion, $459 to $490 million per mile (!)
Cost includes a new bridge over Lake Lady Bird and startup costs such as a train maintenance facility.
The original Red Line in Houston, opened in 2004, cost $43 million per mile, and the Green and Purple lines, opened 2015-2017, cost $153 million per mile.
- Speed: 13.6 miles per hour from north to south; 14.9 miles per hour from north to southeast.
- Estimated weekday ridership: 28,500
Depiction of Austin's plan. This design looks familiar to Houston's.
Fixation on Rail: Austin is Repeating Houston's Mistake
Houston's $1.41 billion Green and Purple lines have very low ridership, easily handled by bus rapid transit (BRT). If the lines had been built as BRT, they could have easily reached Hobby Airport with the $1.4 billion budget, likely with plenty of money left over. The Silver line BRT cost $46 million per mile and the University line is expected to cost $63 million per mile.
If Austin uses BRT instead of light rail, the cost per mile would be drastically reduced. They could build the unfunded extensions shown in the map, and provide service to the airport with no transfer. They could also potentially use the savings to build a tunnel under Lake Lady Bird instead of an undesirable new bridge.
Once again, fixation on light rail causes money to be wasted and transit service to be limited.
Labels: governance, MaX Lanes, mobility strategies, rail, transit, transportation plan
Texas vs. 'induced demand' and tolls
Today is the official 18th (!!) anniversary of Houston Strategies, with the first post on March 8th, 2005. This is the 1,391st post (again, !!). I had no idea it would go anywhere near this long when I started, and I have absolutely no idea how long it will continue to go into the future. No matter how long that is, one thing I do know is - with the legacy limitations of blogspot - it will still have this old-school 2005 web page format, lol. I just hope my readers focus on the content rather than the aesthetics ;-)
This week I have an excellent re-post from Bob Poole at Reason's Surface Transportation Innovations on induced demand:
Experts Spar Over Induced Demand and Urban Freeway Expansion
I-35 through downtown Austin is massively congested much of the day. That’s hardly surprising since both Austin and Texas have been growing by leaps and bounds for several decades (with no end in sight), while I-35 through central Austin still has not had a significant expansion since 1974. Trying to accommodate today’s traffic flow with the capacity of 50 years ago is like trying to put 10 pounds of potatoes into a 5-pound sack.
Yet opponents of expanding I-35 in Austin raise the concept of “induced demand,” which some refer to as the “iron law of freeway congestion.” The idea is that it’s pointless to add capacity because the improved traffic flow will (only) lead to more vehicles choosing to use the freeway, yielding renewed congestion.
One of those who raised this argument is professor and engineer Kara Kockelman, who teaches transportation engineering at the University of Texas at Austin. In a recent piece by Kelsey Thompson of KXAN, Kockelman said that roadway improvements can lead to people changing their behavior, such as living further out in the suburbs or making trips during peak periods that they used to make at off-peak times. “By opening up I-35,” she told KXAN, “what we do is increase the attractiveness of that corridor for longer distance travel.” Also, after a long construction period, “There’ll be a lot of pent-up demand just waiting to get onto that road when it fully opens,” Kockelman added. That’s all true, but it’s not the end of the story.
At about the same time, another transportation expert, Steven Polzin of Arizona State University, published an article on Planetizen, “Induced Travel Demand Induces Media Attention.” He points out that in fast-growing states, most new highway demand comes from population growth and new jobs, not from “induced” travel. Second, he notes that vehicle miles traveled (VMT) per capita have leveled off in the past decade, so traffic congestion will likely not grow as fast in coming decades, other things equal. Third, Polzin points out that trips accommodated by an expanded highway can provide a number of benefits, such as:
- Residents getting access to better jobs and businesses with better selections and lower prices;
- Businesses having access to a larger labor pool, and larger customer and supplier bases;
- Enabling emergency vehicles getting where they are needed faster;
- Pulling cut-through traffic out of neighborhoods; and,
- Enabling parents to get home in time for family meals and activities.
Some of those benefits might not be long-lasting, especially as places like Austin continue to grow. But neither expert mentioned a way to make the expansion benefits last longer: add market-priced lanes instead of free lanes, so the pricing will enable high-value trips to take place even during peaks when the free lanes are getting jammed. Those can be personal trips (to the airport to catch a plane, getting to day-care in time to avoid late fees), enabling express buses to run consistently faster and more reliably, and letting emergency vehicles get where they’re needed quickly, for example. Kockelman mentions toll roads but not express toll lanes. In Houston and especially Dallas/Ft. Worth, the express toll lanes are popular and much-used. But even there, where they have proven their usefulness and popularity, regional plans for a whole network of express toll lanes have been thwarted by the Texas state legislature, which has banned any new Texas Department of Transportation (TxDOT) support for tolled projects, and any new long-term public-private partnerships (P3s) financed by toll revenues.
TxDOT’s earlier concepts for I-35 in Austin called for adding express toll lanes (also known as priced managed lanes). But as I noted in the August 2022 issue of this newsletter, due to the legislative ban, TxDOT’s current plan is to spend $4.9 billion of taxpayers money to add “non-priced managed lanes” to I-35 in Austin. In plain language, that means old-fashioned, ineffective high-occupancy vehicle (HOV) lanes. Based on past history, if built, those lanes will likely be either too empty (wasting costly pavement) or too full (fam-pools, cheaters). Without pricing, there is no “management” of HOV lanes.
In a recent presentation in Ft. Worth, I pointed out that TxDOT’s current plans to add HOV lanes to I-35 in Austin, I-35 in San Antonio, and I-635E in Dallas total $8.1 billion. On average, revenue-financed highway projects like express toll lanes need only 20% from the state DOT with all the rest financed based on toll revenues. Were those three projects carried out via revenue-financed P3s, TxDOT would save 80% of that $8.1 billion to spend on other projects statewide. That ought to appeal to legislators from smaller cities and rural areas. And it would produce a much more effective and long-term solution for the antiquated I-35 through Austin.
Labels: MaX Lanes, mobility strategies, toll roads, transportation plan
Should METRO reconsider eliminating transit fares? (again)
Back in 2019 I laid out the case for METRO to eliminate transit fares and essentially be free (and Bill King did it way back in 2008). which they considered but ultimately decided against. Since then we've had a pandemic that has devastated transit ridership nationwide, and momentum is building around the country for more transit agencies to eliminate fares to raise ridership and speed up trips. Kansas City has been very successful with it, and now DC is moving ahead (hat tip to Jay).
Houston could totally do this since fares are such a small part of their revenue (maybe 3% at this point?). And it would be especially good now because Metro is looking at a huge contract to upgrade its payment systems – all that could be completely saved! But the counterargument completely ignored in this piece is homeless semi-living on the buses, which drives off other passengers.
I think the solution to homeless et.al. would be to kick everybody off at the end of every route before turning around. The question is how hard would that be to enforce by the driver? It might take a few months of stationing transit cops at key places to enforce and build the routine. Another option would be like with driver's licenses: you have a transit pass, and it can be revoked or suspended at any time for violations. Nobody boards without a valid transit pass. Or something similar could be done with facial recognition cameras so people don’t have to carry a transit pass, but suspended riders could be identified.
So there are options for minimizing the downsides of free transit, but METRO would have to be willing to be bold and innovate and experiment. It's potentially
the second-best initiative METRO could take on (after a true
moonshot of aspiring to offer half-hour or less express trip times from every park-and-ride and transit center to every major job center and both airports using a network of MaX Lanes in collaboration with TXDoT and HCTRA, with vehicle size and frequency tailored to demand).
Labels: MaX Lanes, Metro, mobility strategies, transit
2045 RTP survey, #1 permitting, POST HTX diversity, housing costs hurt education, planning tool vs NIMBYs and their mentality
Took my visiting cousin to POST Houston Saturday night and it had the most Houston diversity I've seen in one place in 40 years here, both in food and people. Just incredible. These photos don't do it justice. Every ethnicity in the city was represented! Very cool place worth visiting if you're ever near downtown.
Moving on to a few small items this week:
“Enrico Moretti (2013) estimates that 25% of the increase in the college wage premium between 1980 and 2000 was absorbed by higher housing costs. Moreover, since the big increases in housing costs have come after 2000, it’s very likely that an even larger share of the college wage premium today is being eaten by housing. High housing costs don’t simply redistribute wealth from workers to landowners. High housing costs reduce the return to education, reducing the incentive to invest in education. Thus higher housing costs have reduced human capital and the number of skilled workers with potentially significant effects on growth.”
- Very cool tool that I'm also very glad Houston doesn't need because we don't need the public's approval over what gets built where: Fast Company - This ingenious tool helps cities avoid rabid NIMBY arguments over housing - Balancing Act helps calm the contentious process of deciding where housing should get built.
- NYT: Twilight of the NIMBY - Suburban homeowners like Susan Kirsch are often blamed for worsening the nation’s housing crisis. That doesn’t mean she’s giving up her two-decade fight against 20 condos.
"How does a place (CA) that prides itself on progressive politics have so many policies that exacerbate inequality? How do homeowners whose window signs say they welcome every oppressed group rationalize a housing system that has caused their own children to flee?"
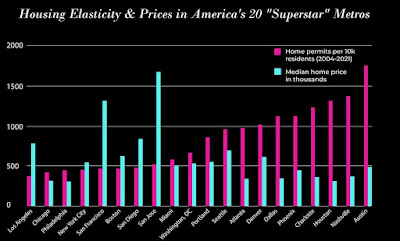
- Market Urbanism Report: "Our latest data dive shows a clear correlation between permit rates fm 2004-2021, and current median home prices, in America's 20 "superstar" metros. Houston remains America's best metro for combining strong population/job growth with low prices. It's also had the most net permits (945,068) over this period. Not a coincidence." Hear hear! Click to enlarge the graph:
Finally, be sure you fill out the H-GAC 2045 Regional Transportation Plan survey before the end of June. They also have a Comment Map where you can add comments to very specific locations. Here was my public comment submission after attending their virtual public meeting:
"Very excited about the REAL network of managed/MaX Lanes! By far the most effective, cost-efficient, flexible, adaptable (to autonomous vehicle technology), and realistic transportation solution for a metro like Houston. Bike lanes and transit are nice amenities but will never be able to address more than a tiny slice of trips in Houston. Houston's future vibrancy and economic success is absolutely critically tied to expanding convenient, fast transportation used by the vast majority of people (cars), and if we ignore that and pretend we don't need to make any more traditional transportation expansions to accommodate growth (like freeways) we will stagnate into gridlock like LA, which has invested tens of billions into transit expansion while overall ridership *dropped*."
Labels: affordability, census, demographics, development, education, growth, home affordability, land-use regulation, MaX Lanes, mobility strategies, perspectives, planning, rankings, technology, transportation plan
Can Houston avoid LA's mobility disaster?
---
Over the past 20 years, Los Angeles County has drastically curtailed highway improvements and poured massive resources into expanding public transit, mostly costly rail lines. The result: disaster.
Tory has mentioned L.A.'s fiasco, including this 2019
WSJ article detailing plummeting ridership and this scathing
2018 report.
Why should we be concerned about the folly in Los Angeles? Because there are voices in Houston, including the majority on Harris County Commissioners Court, who want to bring Los Angeles-style transportation planning to Houston.
Let's take a close look at the disastrous results for Los Angeles, and we'll see why we need to stick with Houston's longstanding emphasis on highway improvements.
High Taxes in L.A. Provide Poor and Worsening Results
LA Metro's program is paid for with a 2% sales tax. The base
sales tax rate in Los Angeles County is
9.5%, with many cities having a rate of
10.25%. This compares to Houston's 1% Metro sales tax with an overall rate of 8.25%.
California localities can raise funds for transportation projects with
4 funding mechanisms for the 2% sales tax, and L.A. uses 95% of the $22.7 billion funding for transit, as shown in the pie chart adapted from the
official page at LA Metro.
Other regions put more toward roads and highways, for example, pro-mobility Orange County uses Measure M to help finance a $2.1 billion
project on a section of the 405.
Currently, there is only one major highway project in progress in Los Angeles County, the Caltrans-managed
CA 71 freeway upgrade in Pomona, 25 miles east of downtown L.A. Most other projects listed on the
Catrans site are complete, or are mainly maintenance work.
Declining Public Transit Ridership
LA Metro public transit ridership peaked in 2013 and was in steady decline through 2019 (pre-Covid),
down 21.9% in this period of strong economic growth. Bus ridership has been in a steady downward trend,
down 24.9% between 2009 (the earliest data on the LA metro site) and 2019. Data source is the official LA Metro
ridership page, which shows plots if you click the Details button.
Looking at the chart, we can see that rail ridership was on a plateau from 2013 to 2017, but was in decline in 2018 and 2019.
This is a pattern that occurs in many cities. Resources are poured into expensive rail lines which have small increments of increased ridership, but losses in bus ridership often due to service neglect are much greater than the rail increase.
Houston Metro performed much better than LA Metro in the pre-Covid period. Houston lost more ridership than LA due to the great recession in 2008, but from 2012 to 2019 Houston Metro showed increasing or steady ridership while LA was in steady decline.
Houston Metro's strong performance is almost certainly due to the
bus service improvements launched in 2015, since the new rail lines opened in 2013 and 2015 have low ridership. (Houston's ratio in 2020 is much better than L.A. since Houston's fiscal year was affected by Covid only 6 months.)
Of course, Covid-19 caused transit ridership to collapse everywhere. The chart below shows the impact on LA Metro over the last 30 months. We can see that bus ridership is recovering more quickly than rail ridership, with bus down 24% compared to 2019 and rail ridership still down 39%.
If there's any glimmer of good news for L.A., it's that ridership is recovering from Covid faster than most places, as national ridership is still down around 46% as of
October.
L.A.'s Transit Emphasis Provides No Reduction in Traffic Congestion
As we compare congestion in L.A., Houston and DFW, we need to consider population growth. We would expect congestion to increase in regions with strong population growth. Houston's metro area
population grew 21.8% since 2010 and
Dallas-Fort Worth grew 20.4%.
Los Angeles County
population grew 1.5% since 2010, but has shrunk 1.35% since its 2016 peak. If public transit improvements reduce traffic, we would expect substantial traffic reduction in L.A., especially considering the stagnant population.
TTI data for the 2014-2019 period show no reduction in traffic in Los Angeles. Fast-growing Houston and DFW both show a slight downward trend in the travel time index, with Houston showing the best reduction and DFW having the lowest congestion. Houston and DFW have focused on highway and toll road improvements, and DFW has built a leading managed-lanes network.
TTI data for
delay per auto commuter shows Houston and Dallas performing better than L.A. from 2009 to 2019 (based on absolute increase), with Los Angeles increasing 23 hours to 119, Houston increasing 22 hours to 76, and top performer DFW increasing 16 hours to 65.
TomTom data, readily available only for 2017-2020, show no pre-Covid traffic reduction in Los Angeles.
Los Angeles (42% congested),
Houston (24% congested) and
DFW (19% congested) are all shown as flat in 2017-2019, but Houston and DFW are at much lower levels than L.A., with DFW the top performer.
Sales tax increases in Los Angeles were sold to the public with promises of reduced traffic congestion. L.A.'s transit-focused planning was not delivering any traffic congestion reduction prior to Covid.
Highway-focused Houston and DFW are accommodating high population and economic growth with steady or declining congestion, with congestion levels much lower than L.A.
Houston Should Stay on the Path to Mobility Success
To summarize, Los Angeles has high taxes, massive spending on rail lines, steadily decreasing transit ridership prior to the Covid ridership collapse, and no pre-Covid reduction in traffic congestion. In recent years, the region's population is declining as people move elsewhere. This is definitely a policy disaster.
We know what fails: Los Angeles-style transportation planning. We know what works: longstanding transportation policies in Houston and DFW emphasizing road improvements. This means we should
- Continue to focus on road and highway improvements
- Recognize DFW's leading performance and its successful managed lanes, and plan for a future managed lanes network that will accommodate transit, ridesharing, and technologies of the future.
- For public transit, avoid costly rail expansions and focus on affordable, flexible and adaptable bus service, including bus rapid transit instead of rail. We can be glad that Houston Metro's $7.5 billion MetroNext plan learns from the Los Angeles disaster, and focuses mostly on expanded bus service.
Labels: MaX Lanes, Metro, mobility strategies, rail, transit, transportation plan
Houston should learn from the future of public transit in Las Vegas
---
Tory and I regularly post about the painful reality of traditional public transit: the extremely high cost of rail facilities, low and declining ridership, susceptibility to events like Covid, and the ongoing need for more subsidies from taxpayers.
Of course, we're not the only ones to notice the poor results of large public transit expenditures. Entrepreneur extraordinaire Elon Musk has established
The Boring Company, and its first project at the
Las Vegas Convention Center has been operational since June. The firm is now poised to proceed with a large 100% privately financed Las Vegas system that is expected to provide a monumental improvement in public transit service quality, which should also bring increased ridership.
For those not familiar, the Boring Company will build tunnels and move transit customers through the tunnels with autonomous electric Tesla vehicles. The key features are on-demand service, private vehicles, and high-speed point-to-point express service. Regular readers know that Tory and I are supporters of a
regional express lanes network for Houston which has the potential to provide this same level of service.
Here is a map of the proposed Las Vegas Loop transit system

Here is a photo of a station at the Las Vegas convention center
The Las Vegas Review Journal reported on the plan for the Las Vegas system on
October 20 and
Oct 14. The improvement over traditional public transit is so large it's mind-boggling. Here are some key points from the articles.
Point-to-point service will provide a drastic speed improvement over traditional public transit. Metro's light rail lines have an average speed of 14 miles per hour.
"The system is planned to be a point-to-point system, so passengers won’t have to stop at each station along the way. A rider could get picked up at the Las Vegas Convention Center, for example, and be directly transported to Allegiant Stadium without having to stop at each resort along the way.
Davis said a 3.6 mile ride between the Las Vegas Convention Center and Allegiant Stadium would take 4 minutes and cost $6 per vehicle."
That's 54 miles per hour!!
Metro's
annual report does not directly report a cost per transit trip, but we can get an average value by using overall numbers. For Metro's most recent fiscal year not affected by Covid (2019), Metro reported 89,951,217 boardings, transit fares of $75,294,678, scheduled service operating expenses of $420,755,621 and total operating expenses of $854,335,088. So pre-Covid, Metro was collecting 84 cents per boarding but spending $4.68 per boarding in direct operating cost and a shocking
$9.50 overall cost per boarding. So the reported Las Vegas vehicle fare (not person fare) of $6 is well below Metro's fully-loaded cost per trip, especially if multiple riders share a vehicle. However, most Metro customers are on trips more than 3.6 miles long.
The Las Vegas service will be on-demand. No more waiting for a bus or train, or needing to be concerned about getting to the stop on time.
"[You] walk into a station and the vehicle is waiting for you. And go directly to your (destination) station, you can really solve the traffic problem."
The capacity of the planned 15 mile system is very high. In September 2021 Metro served 151,000 weekday trips, down from 303,000 weekday trips just before Covid.
"Once fully operational, Davis said the system is expected to handle 57,000 riders per hour."
We all know how the entrepreneurial culture of SpaceEx has empowered the SpaceEx Dragon launch system to outperform the competing Boeing Starliner, which is plagued by
delays and technical problems. The Boring Company's new thinking about transit has the potential for massive gains in financial performance. The entire 15-mile dual loop system is slated to be built in 3 years at no cost to taxpayers. No more waiting decades to get infrastructure built. And while tunnels built by public transit agencies are now absurdly and obscenely expensive, typically $500 million to $1 billion per mile, the smaller and simple tunnels used by the Boring Company can keep the cost feasible.
"The entire system will be funded privately, with no taxpayer money used to construct it.
Boring will have three years to complete construction or have at least a portion of the system that is in the county’s right-of-way in operation."
The system has the potential to be a source of revenue for local government, instead of being the ongoing money pit of traditional public transit. Remember, once upon a time (1950s and before) public transit was a private, for-profit activity in most U.S. cities and did not require taxpayer subsidy.
"Boring would be required to pay the county a quarterly franchise fee dependent on how much revenue is generated each quarter.
Quarterly gross revenue less than or equal to a threshold of $17.5 million would result in a 0.5 percent quarterly payment of that gross revenue to the county. If quarterly gross revenue surpassed $17.5 million, Boring would pay the county 0.5 percent of the first $17.5 million and 5 percent of any revenue in excess of that."
Sure, the Las Vegas Strip is a special case due to the high demand for service on the corridor, and we can't expect Houston or other low-density cities to match a Las Vegas system. But the key takeaway is the three features for providing successful transit service in the future: on-demand service, private vehicles, and high-speed point-to-point express service. With the revolutionary service improvement provided by these features, we can expect increased transit patronage and the associated benefits for regional mobility.
Houston's future transit system should strive to achieve these goals, and as technology advances it should become feasible to provide this level of service on non-tunnel dedicated or shared facilities, such as bus rapid transit facilities and
managed MaX lanes. By using BRT facilities and managed lanes, the construction cost will be lower and the average trip cost should also be lower. I can envision a hybrid system, where tunnels are used in high-congestion areas like downtown, Uptown, and the Texas Medical Center, while lower-cost surface or elevated guideways are used elsewhere.
While Houston may not be able to command a concession fee like Las Vegas, we can envision a public-private partnership where public funds may be used to contribute to construction costs, lower trip costs, and/or provide fare relief for low-income customers.
Let's hope Houston's leadership will closely follow the developments in Las Vegas and position Houston to become a leader in public transit of the future.
Labels: autonomous vehicles, MaX Lanes, Metro, mobility strategies, transit, transportation plan
What the Katy Managed Lanes tell us about the NHHIP 45N expansion project
---
Managed lanes are one of the more controversial features in the
North Houston Highway Improvement Project. The current HOV lane uses 25 feet of width in the center of the existing freeway where there are no interior shoulders, and 41 feet of width where there are interior shoulders. In the NHHIP design, the managed lanes require 82 feet and the interior shoulders (with pylons) require 25 feet, for a total of 107 feet. So the extra width required for the managed lanes is 66 to 82 feet, which is about 37% of the needed new right-of-way north of Loop 610. The rest of the needed right-of-way is for buffers outside the frontage roads (27 feet on each side), wider frontage roads including a 15-foot-wide shared lane, more space between the main lanes and frontage roads, and auxiliary (merging) lanes for the main lanes.
The City of Houston
proposal, which is endorsed by Harris County, would remove the managed lanes entirely and also remove the existing reversible HOV lane. Other opposition groups want more public transit emphasis and no right-of-way acquisition which would eliminate the managed lanes.
Of course, we already have a managed lane facility in Houston, the Katy Managed Lanes. Let's take a closer look at its performance, before and after Covid. Data sources:
Metro and
HCTRA.
Attention NNHIP Opposition: Managed lanes have demonstrated substantial transit ridership
In 2019, prior to Covid, Metro's bus routes using the Katy Managed Lanes served 9,105 weekday public transit trips, more than the $756 million Red Line north extension and the Green or Purple Lines, which together cost $1.4 billion. The original Red Line, which has strong ridership, had 42,385 weekday trips.
HOV and Ridesharing provide even more SOV reduction
Metro bus service is only part of the reduction in single-occupant vehicles provided by managed lanes. The main purpose of the Katy Managed Lanes, which require only 2 persons per vehicle for free use, is to promote carpooling and ridesharing. In contrast, most managed lanes facilities outside Houston require 3+ occupancy for free use, and privately owned managed lanes are operated to maximimize toll revenue. While there is no readily-available data for HOV traffic count, Metro's 2018
Highlights publication (p.28) states the following
"METRO provided 7.7 million Park & Ride commuter bus rides in 2017"
For all HOV/HOT lanes except the Katy Freeway managed lanes (which is operated by HCTRA), Metro reports
"An additional 25.4 million people used HOV/HOT lanes operated by Metro in 2017."
Even excluding the heavily-used Katy managed lanes, the ratio of HOV/HOT users to bus riders is 3.3 to 1. There's no information on the number of HOV vs. HOT vehicles, but the pre-covid Katy Managed Lanes bus ridership of 9,105 trips per day probably translates to HOV trips of at least 20,000 per weekday, which (assuming 2-person HOV) was taking at least 10,000 SOVs off the road.
Managed lanes serve vanpools, and Metro reports (for all its HOV lanes)
"METRO facilitated 2 million vanpool rides and more than 700 active vanpools in 2017."
The 2018 report also states
"HOV/HOT lanes maximize the utility and value of existing freeway lanes by allowing riders and vehicles to move faster and bypass heavy traffic."
That statement should put a smile on Tory's face, since his brand name for managed lanes is
MaX lanes.
(editor's note: It does! :-)Impact of Covid
Metro's overall ridership dropped by around
55% for most months since April 2020. Park & ride customers are not transit dependent, so they could switch to their cars for safety, and they are mostly professional so many or most could work from home. Consequently, park & ride service was hit much worse, with Katy corridor ridership down around 88%.
Metro's downtown routes (221, 222, 228, 229) were down 95% in the year after Covid hit (excluding the uptick in recent months). However, ridership on Metro route 298, which provides service to the Texas Medical Center, was down only 53%, which is consistent with the overall loss in Metro ridership. Assuming route 298 riders don't have the option to work from home, this suggests that (95-53)/95 = 44% of the downtown route ridership loss was due to working from home. Of course, folks working from home will no longer be Metro customers in the future. Recovering these riders will depend on how many continue to work from home.
Revenue Generation
In 2019, the Katy Managed lanes generated $20.7 million in toll revenue, below its 2018 peak of $22.5 million. We can expect a rebound from the 2020 value of $8.9 million, but it may take years to get back to $20 million.
Managed lane toll revenue is low by HCTRA toll road standards, as HCTRA collected $855 million in toll revenue in 2019. The adjacent section of the Sam Houston Tollway to the south (to the Southwest Freeway) generated $116 million and the section to the north (to the Northwest Freeway) generated $98 million.
However, $21 million is substantial in the context of Metro's systemwide total farebox revenue, which was flat between 2013 and 2019 in the range of $72 million to $76 million, and was $75 million in 2019. Farebox collections for FY 2020, which ended in September with only 6 months affected by Covid, dropped to $43 million. Just completed FY 2021 (no data available yet) was fully affected by covid and will be much lower.
Metro's park & ride bus service also generates substantial farebox revenue due to its high fares. In the 15 months prior to Covid, the
Grand Parkway endpoint was the most-used park & ride lot in the Metro system, averaging 2,977 daily trips. The fare for Grand Parkway service is $4.50, compared to $1.25 for regular service, which is diluted by discounts. Using an average fare of $4.25 for Metro park & ride service using the Katy Managed Lanes, we can estimate those routes generated 9105*52*5*4.25= $10.0 million in fares, which is 13% of 2019 Metro systemwide total farebox revenue. Adding together the toll and farebox revenue is $30.7 million, which is 41% of Metro's systemwide total farebox revenue.
| dollar values in millions |
2019 |
| Toll Revenue |
$20.7 |
| Bus Fares (estimated) |
$10.0 |
| Katy Managed Lanes Total |
$30.7 |
| Metro 2019 systemwide farebox revenue |
$75.3 |
| Katy Managed Lanes revenue, percent of Metro systemwide farebox total |
41% |
Managed Lanes: more services provided = less risk of obsolescence
Suppose rail transit had been built instead of the managed lanes along the Katy Corridor. Rail would serve only commuters using public transit, and demand for that service was down 88%. Of course there will be a recovery, and there has been an uptick in recent months, but it remains to be seen how much of the lost ridership can be recovered. Due to work from home, demand for commuter transit will likely be suppressed indefinitely.
In today's money, rail infrastructure for the 19 miles from the Northwest Transit center at Loop 610 to the Grand Parkway would cost at least $1 billion for commuter-style trains, and at least $2 billion for light-rail style service. (Of course, the trains would have terminated at the Northwest transit center and required a transfer, which would lower ridership.)
With the dramatic drop in commuter ridership, rail infrastructure would now be a very expensive and very underutilized asset.
Managed lanes provide multiple services, including ridersharing, vanpools, and express toll service. This lowers the risk of the investment. While these services were also down (toll revenue was down 57%), these services continued to be served, with toll users at a much higher level than commuter bus.
This underscores another major benefit of flexible, adaptable, and less expensive managed lanes. If consumer preferences shift, the lanes can easily adapt and won't become a costly "white elephant".
Managed Lanes: a crucial feature of NHHIP
To summarize
- Pre-covid, the Katy Managed Lanes demonstrated strong transit ridership, higher than much more expensive recent light rail expansions.
- Pre-covid, the Katy Managed Lanes demonstrated strong revenue generation, both tolls and bus farebox.
- Ridesharing on managed lanes provides substantial SOV reduction, probably exceeding pre-covid transit.
- With the onset of covid and the collapse of demand for commuter transit service, the Katy Managed Lanes continued to provide multiple services, underscoring its adaptability to shifting needs.
Managed lanes are the most important feature of NHHIP north of downtown, providing an adaptable transportation asset that will serve Houston's future needs, whatever they may be: bus rapid transit, commuter bus, HOV, vanpool, technologies of the future such as automated vehicles and potentially toll service. (Current plans don't include tolls, but would optimize the lanes for transit and ridesharing.)
Strong performance, low cost, and adaptability are reasons why Tory and I support the NHHIP managed lanes and are advocates of a managed lane network for Houston, as described in the MaX lanes report and as proposed in the TxDOT REAL plan.
Labels: commuter rail, congestion pricing, MaX Lanes, Metro, mobility strategies, rail, toll roads, transit, transportation plan
Houston's blob is about to eat even more of East Texas... and we should embrace it
I recently submitted this op-ed to the Houston Chronicle:
The Chronicle’s recent article debating the sustainability of Houston’s traditional “build more” approach to growth (“Houston became 'the blob that ate East Texas' by building big. Is it time for that to change?” August 27) frames the debate as if Houston can dictate whether people drive cars in the suburbs or ride transit in the densifying core, when in reality people make their own choices which we can accommodate and thrive or ignore and decline.
The debate completely misses the reality of our post-pandemic world. Remote work is now a permanent part of our economy, and it is creating a tidal wave of suburban and exurban growth as people realize they’ll no longer need to commute into the city on a daily basis. Houston can’t stop it, even if it wanted to. All we can do is try to accommodate it while keeping the core healthy and accessible to attract their dollars for discretionary shopping, restaurants, entertainment, events, health care, philanthropy, office visits, and more. And if we don’t maintain that accessibility - including prudent transportation investments - not only are they unlikely to visit, their employers are likely to leave as well along with their much-needed local property and sales tax contributions.
Houston’s great strength has always been embracing growth - suburban, urban, and the freeways to connect it all together. That formula has kept us the most affordable major metro in the country and always near the top in growth rankings. In other words, we’ve made ourselves extremely attractive to newcomers, especially diverse people of color and immigrants looking for affordable opportunity. We’ve got a product people want. Why would we want to radically change that? Especially to models like California with urban growth boundaries, constrained development, astronomical housing costs, traffic gridlock, and wasteful transit spending (LA has spent upwards of $20 billion only to lose 21% of its ridership pre-pandemic) resulting in a mass exodus of both people and businesses.
What Houston’s formula needs is tweaking, not throwing out the baby with the bathwater. For example, with growing concerns about flooding, the answer is not banning new development, but tightening runoff regulations on new suburban developments so they don’t flood us downstream. Every new development should have enough detention that the land releases even less water during a hard rain than it did undeveloped - then every new development would actually reduce flooding!
And when it comes to transportation investments, yes, many freeways are reaching realistic width limits, but that doesn’t mean we should give up growth for perpetual congestion or old, slow transit. We’ve proposed - and TXDoT is planning - an innovative next-generation mobility strategy: a network of MaX Lanes (Managed eXpress Lanes) 'moving the maximum number of people at maximum speed' by allowing direct point-to-point single-seat high-speed trips by transit buses and other shared-ride vehicles today, and even higher-speed zero-emission autonomous vehicles in the future. The network would enable Houston’s seven core job centers to scale from 626,000 jobs today to over one million jobs in the future while drawing employees from all across our ever-expanding region with a reasonable commute (even if they’re doing that commute less often in a remote work world). This is the type of climate-friendly innovative mobility solution that could attract substantial federal funding while also embracing suburban and exurban trends rather than hopelessly fighting them.
Finally, Houston’s unzoned urban core can continue to naturally densify as it has been doing successfully for at least two decades now - not because we’re trying to force it to, but because people - especially diverse young people - choose it. They choose it because we allow the free market to build and cater to that demand, including townhomes, apartments, residential towers, and walkable mixed-use complexes.
Which brings us full circle to Houston’s secret sauce: building what people want rather than what academic urban planners deem the ‘right’ way to live and get around. That strategy will always be a winner.
Tory Gattis is a Founding Senior Fellow with the Urban Reform Institute - A Center for Opportunity Urbanism, and the Editor of the Houston Strategies blog.
Labels: affordable proximity, autonomous vehicles, congestion pricing, development, economic strategy, growth, infrastructure, MaX Lanes, mobility strategies, remote work, sprawl, toll roads, transit, transportation plan
METRO Update, Inner Katy BRT, and Epic Failure of Transit-Oriented Development Ridership in Dallas
The Latest Metro Ridership
Metro ridership has been stuck around 55% down for the last year, and was down 54% with 138,975 weekday boardings in the most recent data. Nationally, transit patronage has come up from its 2020 low point, reaching 50% of pre-covid patronage in June.
For perspective, average daily highway traffic on the Katy Freeway near Gessner dropped 18% from 387,769 in 2019 to 317,629 in 2020. Traffic counts are reported with a single annual value, and highway traffic in 2021 has returned to near pre-Covid levels in most places.
The Inner Katy BRT
Metro held a virtual meeting on August 16 for the Inner Katy bus rapid transit (BRT), part of the MetroRapid feature of MetroNext, which will provide a fast connection to downtown for commuter bus services on the Katy and Northwest freeways, and also provide service to the new Uptown BRT. A nice feature of the Metro's depictions is that the stations will have bypass lanes for express buses, so they won't be slowed by local service.
Separately, TxDOT is studying the addition of managed lanes on this segment, and one of TxDOT's options is covered by Metro Option 3 (Tell Metro you support Option 3 here!). The managed lanes are the most critical link in the MaX lanes network which Tory and I have promoted, and would also be part the REAL Network being planned by TxDOT. Unfortunately, H-GAC recently denied TxDOT's request to include the managed lanes in the regional plan. The project will be reconsidered for inclusion in May 2023.
Regular readers will know that Tory and I are big advocates of BRT as a much better alternative to light rail, so we are glad to see this BRT project moving forward. To summarize the advantages of BRT:
- Light rail is obscenely expensive, with the most recent Metro expansions which opened in 2013 and 2015 costing around $152 million per mile, and the current national average just over $200 million per mile. BRT is far less expensive. Although cost reduction will vary, a good estimate is that BRT costs one-third as much as light rail.
-
Light rail is painfully slow, with MetroRail averaging 14 miles per hour, slightly slower than than the national light rail average of 15.8 mph (page 5). Street-level BRT will be about the same, but grade-separated BRT such as the Inner Katy BRT should be at least twice as fast.
- Light rail is totally inflexible and unadaptable, usable only by trains. With BRT, buses can serve any route and then enter the BRT facilty. A BRT guideway could potentially be used by technologies of the future, such as automated transit vehicles.
- Metro's light rail expansions opened in 2013 and 2015 have low ridership. Pre-covid (Jan 2019 through March 2020), the Red Line north extension ridership on a per-mile basis was only 24% of the original Red Line, and the Green/Purple Lines combined were only 21% of the original red line.
- Street-level light rail is subject to conflicts with cars and pedestrians, while grade-separated BRT as planned for the Inner Katy project eliminates this hazard.
Metro's project site does not provide a cost estimate for the overall 7.6-mile project, and the final cost may vary substantially depending on the option selected and the number of stations. The current H-GAC TIP (page 4-55) lists construction cost at $190 million and total cost at $228 million, which seems low. All Metro's options include an elevated guideway section along the Katy Freeway about 4 miles long.
Difficult-to-reach Stations
Metro's depictions show very inconvenient access to the BRT stations. Starting at ground level, patrons will need to go up an access tower to reach a skybridge which is 35 to 40 feet above the ground, cross the skybridge to the station and then go down to reach the platform. Mobility-impaired patrons will need to take two elevators to travel from ground level to the platform. It will take at least 30 seconds to reach the platform from ground level, making security more difficult.
My immediate reaction was that Metro should consider shifting the stations to be just south of the freeway so there is only a single, shorter ascent/descent for the boarding platform. At most proposed locations, this would require only minor additional right-of-way, such as the Circle K at Shepherd or the warehouse at Studemont.
Number of Stations: Less is More
Metro originally planned two stations at Shepherd/Durham and Studemont, but due to community input they are now looking at 4 additional stations, at Houston Avenue, Yale/Heights, TC Jester and Memorial Park.
Every station imposes a cost. There is the initial construction cost, and then the ongoing cost of operation, maintenance, and security. But the most significant impact is on the service speed: every station causes a slowdown in the average speed of service, and slower service makes transit less attractive to potential users. So it's a bad policy to add stations just to placate a few people who want a stop.
None of the 6 potential station locations have the characteristics for high ridership, because none are near an employment center, transit-dependent populations or high-density housing (but more on that subject later).
The Houston Avenue station can't be justified. It's already served by Metro Route 44, and it's so close to downtown that time savings for local residents using the BRT would be minimal. The number of residents near this station going in the reverse direction to Uptown is surely negligible. In addition, the area to the north has no opportunities for new development.
Five stations on this 3.4 mile section can't be justified, so Metro will need to carefully consider the locations and hopefully stick with two.
Can a Memorial Park Station be Justified?
The Memorial Park station ranks highest in community feedback, with around 46% of respondents rating it as extremely important. But is the public being realistic about actually using public transit to go to a park? I think this situation is very similar to public transit service to the airports. People view it as highly desirable, but for many reasons very few people actually use it.
- There is ample parking available at Memorial Park, free outside the main activity area, which eliminates a major reason to use public transit.
- Many park users bring equipment and drinks. This especially includes golfers but also softball players, tennis players, and people with children in strollers. Driving is much more convenient when you have equipment.
- After completion of park activities, most people will want go home quickly. If you're tired and/or sweaty, do you want to walk the distance to the BRT station and wait for the next bus?
- Most park visitors go to the park outside of peak traffic periods, so traffic is light for most visitors, eliminating another reason to use public transit.
- Since park patrons outside the loop and in Uptown are most likely to drive, patrons using BRT would be coming from inner loop stations and downtown. There is generally a low number of residences within 1/4 mile of the proposed stations.
- In Dallas, White Rock Lake Park is their approximate equivalent to Memorial Park. The DART Blue Line light rail has its White Rock station on the north edge of the park near a major street (Loop 12). Granted, this is not a perfect analogy since White Rock Lake park is so large. The White Rock station served 406 weekday boardings in the most recent data, which is the second lowest ridership for a station on the north Blue Line and ranks #50 among the 64 DART light rail stations.


Realistically, the main ridership of a Memorial Park station would be people living in the Rice Military area who will use it to go to work downtown or Uptown. Metro will need to carefully consider if that is enough to justify a station.
Epic Failure of Transit-Oriented Development LRT Ridership at Irving's Las Colinas
Transit-oriented development seeks to build high-density housing near transit stations to encourage use of public transit. There's limited or minimal opportunity for TOD near the proposed BRT stations, but even if there was good opportunity, we can't assume TOD would increase ridership.
In Irving (just northwest of Dallas), DART's Las Colinas Urban Center seems to be a perfect implementation of TOD: there are thousands of apartments within easy walking distance of the station, and numerous large office buildings about 1/4 mile away. The DART Orange Line provides direct service to major employment centers at DFW Airport, the Dallas medical district, Uptown/Victory and downtown Dallas. A university and community college also have stations on the line. So this should be one of the best performing stations in the DART system, right?
No, just the opposite. The Las Colinas Urban Center station has the second-lowest ridership in the DART system (see above chart, data source). It served a dismal 170 boardings (roughly 85 people on a round-trip) per weekday in DART FY 2020, which was partially affected by Covid, and had low ridership before Covid. The adjacent Irving convention Center station has the fourth lowest ridership in the system, and the other adjacent station at the University of Dallas has the lowest ridership in the system.
It's poignant to realize that the Orange Line was routed through the middle of Las Colinas to make it convenient to potential users, but the street-level alignment forces it to go slowly through the area, reducing service speed and possibly lowering ridership on the overall Orange Line.
Sure, someone may be able to point to a TOD somewhere which can claim improved transit patronage. But TOD is a total bust for public transit patronage in Las Colinas. So be skeptical when officials promote transit-oriented development.
Labels: MaX Lanes, Metro, rail, transit, transit-oriented development, transportation plan


