Tuesday, June 02, 2026

Houston Metro vs. Dallas DART: Houston wins as costly light rail nearly destroys DART

Another fantastic and devastating (for DART) guest post from Oscar Slotboom.

---

Updated 6/3/2026 to include the official announcement of the Dallas Stars moving to Plano
2026 has been very bad for downtown Dallas. On January 5, AT&T announced it will leave downtown to build a new $1.35 billion headquarters complex in Plano. In May, Fifth Third Bancorp announced it will leave downtown, vacating 222,900 square feet of space in a prominent towner. On June 1, the Dallas Mavericks announced they will leave American Airlines Center, with its DART light rail station, to move to the former Valley View Mall site along Interstate 635 (LBJ Freeway) in North Dallas with no light rail service. Like a one-two punch, the next bomb dropped on June 2 when the Dallas Stars officially announced they will leave downtown to move to the Shops at Willowbend site in Plano, which has no light rail service. These events are the culmination of years of decline for downtown Dallas (more below).
How can this be happening? Dallas Area Rapid Transit (DART) has 93 miles of high-quality light rail focused on downtown Dallas. Shouldn't light rail be an asset which attracts and retains downtown tenants? The typical response would be to say these departures are happening in spite of the light rail system serving downtown. But the more likely reality is that downtown lynchpins are fleeing partly because of the light rail system, and its affiliation (justified or unjustified) with unsavory elements and perceived high crime rate.
Earlier this year, DART had bigger problems than the ongoing loss of potential customers at its downtown hub. Six member cities, fed up with DART's high costs and unwillingness to share sales tax revenue, threatened to leave DART. In February a compromise was reached, preserving DART at least through 2031.
With all the news about DART, it's a good time to do an analysis of Houston's Metro vs. DART, to find out how the two agencies compare on key performance statistics. Spoiler alert: Houston performs far better in nearly every key statistic. The reason is because DART spent massively on downtown-focused, high-cost light rail. Houston has far less light rail, even with the cringe-worthy Green and Purple lines, which has enabled Metro to have much better financial performance.
This map shows the 119-mile DART light rail system and its connections to other rail service. The system is heavily focused on downtown Dallas, which is in serious decline while almost everywhere else in North Texas is booming.
Key Statistics
All data is for 2025 except as noted. (Metro, DART) Unusually bad statistics are highlighted with red, good statistics are highlighted with green.

Houston Metro DART
Year created 1978 1983
Service area 1307 sq miles 700 sq miles
Service area population 4,038,849 (2024, source) 2,646,340
Light rail miles 22.7 119
93 as of 2025
Light rail standards Low High
Employees 4,779 3,512
Sales tax rate 1% 1%
Sales tax collection $1,086 million $900.4 million
Per capita taxation $268.88 $340.23
Sales tax sharing with member cities 25% target
27.1% since 2002
23.3% since 2016
none until 2026
5% in 2026
rising to 10% in 2031
Ridership (boardings) 78,642,439 54,175,258
Ridership per capita 19.5 20.5
Year of peak ridership 2006 2013
Ridership loss since peak -23.5% -24.0%
Ridership loss since Covid (U.S. average -15.2%) -12.6% -21.6%
Operating expense $1,076 million $1,021 million
Operating loss $1,027 million $959.1 million
Average taxpayer subsidy per boarding $13.07 $17.70
Long term debt $758.8 million (page 99) $4.027 billion (page 81)
Long term debt per capita $188 $1522
Interest on debt $28.1 million (page 100) $144.4 million (page 11)
Interest + principal $98.2 million (page 100) $210.8 million (page 83)
Ridership
DART steadily expanded its light rail system after the first opening in 1996, reaching 93 miles in 2014, all focused on downtown Dallas. (A 26-mile line from Plano to DFW airport opened in fiscal 2026 and is not included in ridership data.) Houston opened the first section of the Red Line in 2004 and the system reached 22.7 miles after expansion in 2014.
Houston Metro ridership peaked in 2006 and in 2025 was 23.5% below the peak and 12.5% below the pre-Covid 2019 ridership. DART ridership peaked in 2013 and in 2025 was 24.0% below the peak and 21.6% below 2019 ridership. In March 2026 the national average for ridership vs. 2019 is down 15.2%, so Metro is performing better than the national average and DART is worse.
The plot shows that DART's ridership between 2002 and 2019 was basically flat, even with huge spending on light rail. Of course ridership collapsed in 2020 due to Covid.
Metro and DART are now in a very similar position in terms of ridership. Per capita ridership is close, 19.5 for Metro and 20.5 for DART (see table). Metro is 23.5% below its peak and DART is 24.0% below its peak.
DART's extensive and costly light rail system, including DFW airport service, does not provide better ridership performance.
Sales Taxes, Revenue Sharing and the DART revolt
A huge flow of sales tax revenue goes into the bank accounts of Metro and DART. Inflation-adjusted tax collections are up 73.1% for Metro and 66.1% for DART since 2003.
While the population of the DART service area (2,646,340) is only 65.5% as large as Metro's (4,038,849 in 2024), DART sales tax collection is 82.9% as large as Metro's. DART's per capita taxation is $340.23 per year, and Metro's is $268.88 per year.
Houston Metro has had a formal policy of sharing sales tax revenue with member cities since 1988, traditionally called "general mobility" funding and, in financial statements, "local infrastructure assistance". The target for infrastructure assistance is 25% of sales tax revenue. 2025 was 30.1%, the 10-year average since 2016 is 23.3%, and the average since 2001 is 27.1%.
DART, however, never had a sales tax revenue sharing program. (There was a one-time transfer in 2022.) Certain member cities, particularly Plano, Farmers Branch and Irving, became increasingly frustrated about their high sales tax payments to subsidize high-cost DART, leaving them with no resources for other transportation needs. In recent years DART consistently refused to return sales tax revenue to member cities. Legislation was introduced in the Texas Legislature to mandate DART return 25% of its sales tax revenue to member cities, but the legislature was unwilling to get involved in the local issue. The situation came to a boiling point in 2026, when six member cities - Plano, Irving, Farmers Branch, Addison, University Park and Highland Park - scheduled elections to withdraw from DART. After months of negotiation, an agreement was reached for DART to share some sales tax revenue with member cities, starting at 5% in 2026 and reaching 10% in 2031. Plano, Irving and Farmers Branch canceled their withdrawal referendums. Addison, University Park and Highland Park proceeded with elections, and only Highland Park voted to withdraw.
DART's high costs and unwillingness to share revenue nearly resulted in the collapse of the agency. In contrast, Metro's longstanding revenue sharing targeting 25% has empowered member cities to meet their local mobility needs.
Taxpayer Subsidy per Boarding
Average subsidy per boarding is the cost covered by taxpayers every time someone steps onto a bus or train. A transit roundtrip is two boardings. This subsidy is calculated by dividing the operating loss by the number of boardings.
While both Metro and DART have high average boarding subsidies, DART's $17.70 subsidy is significantly worse than Metro's $13.07.
The DART web site scorecard page (click Finance button) reports the bus boarding subsidy is $13.93, the light rail subsidy is $11.73, and the paratransit subsidy is $72.92 in April 2026. In my view the average subsidy per boarding for all services is the best indicator of agency cost and the best number for comparison.
Debt and Interest Payments
DART incurred substantial debt to build its light rail system. The 2025 financial statement shows $4.027 billion in long-term debt.
Houston Metro's financial statement shows $758.8 million in long-term debt. Metro's per-capita debt of $188 is only 12% of DART's $1522.
Metro's interest payment is only $28.1 million per year, compared to $144.4 million for DART.
Houston is in a vastly better position than DART, with far lower debt and lower interest payments. Page 18 of the Metro annual report states, "The debt payable balance has been declining during the last several years as principal payments were made, and the amortization of premium/discount occurred." Metro acheived this superior financial position because it built much less light rail, even with the ill-advised Green and Purple Lines and their disastrous ridership.
Light Rail Doesn't Save Downtown Dallas
An extensive light rail system focused on downtown should help ensure a vibrant and growing downtown, right? No, not in Dallas. Downtown Dallas has generally been stagnant or in decline since light rail service started 1996.
After AT&T, the Dallas Mavericks and the Dallas Stars dropped their departure bombs, the outlook for downtown Dallas became increasingly grim. The downtown office vacancy rate is projected to reach 35% after AT&T and other departures.
On December 28, 2025, the Wall Street Journal reported on downtown Dallas with an article "Dallas Is Booming—Except for Its Downtown"
DALLAS — This city is a hotbed for commercial property. The metro area’s population is booming and financial-services firms are flocking here, earning the area the sobriquet “Y’all Street.”
Yet at its heart is one of the country’s worst-hit central business districts: Downtown Dallas.
Companies are abandoning this neighborhood and its aging office towers. They are heading to the Uptown district or the thriving suburbs, often over concerns about crime and homelessness. Left behind are defaulted loans, foreclosures and deeply discounted property sales.
Dallas’s downtown has the second-highest office vacancy rate of any in the nation, behind Seattle. Downtown Dallas, the central business district, was at 27.2% at the end of the third quarter, according to real-estate data firm CoStar. In Dallas’s Preston Center district, 7 miles away, the office vacancy rate was only 5.9%.
The Wall Street Journal recently reported on downtown Denver, another city which built extensive train service to downtown, only to see its downtown become a wasteland as employers fled to the suburbs. "Can This Guy Get People to Live in America’s Emptiest Downtown?"
America’s downtowns are suffering a crisis. Office work has migrated into the suburbs, leaving abandoned buildings and blighted conditions behind. Central business districts from St. Louis to Dallas and Portland, Ore., are fighting to escape a death spiral.
Downtown Houston has had and continues to have struggles, with office vacancy at 28.9% in March. (The Wall Street Journal report used older or different data.) I think downtown Houston is in a better position than downtown Dallas, but that subject is beyond the scope of this post.
Conclusion
Here are the consequences of of DART's high-mileage, high-cost, downtown-focused light rail system
  • Inability (and unwillingness) to share sales tax revenue with member cities, leading to a revolt which put the agency's future at risk
  • High debt, 5.3 times higher than Metro, with per-capita debt 8 times higher than Metro
  • Downtown Dallas is among the worst performing downtowns in the United States, with lynchpins AT&T, Dallas Mavericks and Dallas Stars announcing departures this year.
  • Long-term ridership comparable to Metro, but worse than Metro and the national average since Covid
  • A sky-high $17.70 average boarding subsidy ($35.40 for a roundtrip)
  • High per-capita taxation, $340.23 vs. $268.88 for Metro
In the Houston vs. Dallas transit performance contest, Houston wins by a landslide, mainly because Houston has built much less light rail.
As I've posted in the past, the future of public transit is new, low-cost technology: automated Robotaxis and low-cost tunnel transit built by The Boring Company.

Labels: , , , , , ,

Wednesday, February 28, 2024

The Benefits of Congestion Relief

The Antiplanner has an excellent post that deserves its own dedicated post over here because it gets at what's wrong with one of the most pernicious fallacies regarding highway congestion relief. Key excerpts (bold highlights mine):

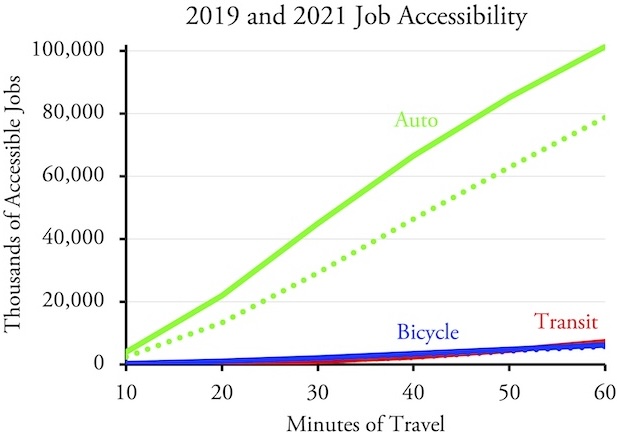
"Data published by the University of Minnesota Accessibility Observatory a few months ago reveals some of the benefits of congestion relief that resulted from the COVID pandemic. I’ve used 2019 data in the past to show that residents of U.S. urban areas can reach far more jobs in a 20-minute auto drive than a 60-minute transit trip. The latest data for 2021 reveal that the number of jobs reachable by transit or bicycle was about 9 percent greater in 2021 than 2019, but the number reachable by a 20-minute auto drive was 66 percent greater.

On average, over 50 urban areas and for trips of 10 to 60 minutes, auto users were able to reach 48 percent more jobs in 2021 than in 2019. Solid lines show 2021 and dotted lines show 2019.

The Texas Transportation Institute documents that congestion in U.S. urban areas dramatically rose between 1982 and 2019. The average number of hours of delay imposed on individual commuters grew by nine times. This growth was because many cities had made a deliberate decision not to try to relieve congestion under the argument that increased capacity simply leads to more driving.

The response to this should have been: So what? Very little driving is frivolous. Instead, most of it is people trying to get to work, school, shopping, health care, friends and relatives, or recreation activities. Then there are trucks moving freight, bringing construction materials and services to work sites, and so forth. Anything that results in more such travel is a good thing because it means more economic activity, more income for people, and more access to better housing, lower-cost consumer goods, and other benefits. The sign of failure is if the new road capacity isn’t used, not if it is.

...

Since 1992, the earliest year data are available, U.S. transportation agencies spent more than $320 billion ($420 billion in today’s dollars) constructing and reconstructing rail transit

On the other hand, if cities had spent even a quarter of the hundreds of billions of dollars spent on rail transit projects since 1992 on highway improvements instead, the congestion relief those improvements would have provided would have allowed far more economic activity, giving low-income people access to better jobs and everyone access to more affordable housing and other benefits. Like most wars, the war on the automobile has done far more economic harm than the negligible benefits it provided."

Labels: , , , ,

Thursday, March 16, 2023

Transit in crisis, great train robberies, NIMBYs are killing America, why 15-min cities are flawed, and more

 Just clearing out some backlogged misc items this week:

"Much of the national media, in chorus with urban political and economic leaders, have been pushing these train-focused approaches since the days of Jimmy Carter. The stated aim is usually to move Americans away from their supposedly evil and pernicious love of the private automobile. Americans drive not because they irrationally love cars—although some do—but because it is simply by far the best way to get around. 
We know this because for the most part, train-heavy investments have reaped little in terms of riders and virtually no reduction in auto usage. Indeed, even before the pandemic, transit ridership, despite the creation of new lines, was sagging. Since then transit has continued and accelerated its decline. By the end of 2022, the transit market share had fallen 50%. Today, despite the end of the pandemic, that number has barely moved at all. It is into this fading market share that the current administration and much of the political class now wants to throw its money."

“The country can no longer afford this form of “shadow subsidy,” Smith argues. If America continues on this path, standing by the “build-nothing” mindset, then the middle class will slip into “genteel poverty” and America will lose its leading position in the global economy, he claimed indirectly, albeit poetically: “Someone else will build the future on the bones of our civilization.”  

He urged America to slash the “thicket of red tape” around development, and it seems the world’s richest man agrees.”

"If 15-minute cities were so great, we would still be living in them. But as soon as people got cars, they moved out of them and used their new-found mobility to get better housing, better jobs, and a wider variety of low-cost consumer goods.

Every city in America is a 15-minute city if you take automobiles into account. Thanks to automobiles, the typical U.S. urban resident lives within 15 minutes of more than 100,000 jobs, several different supermarkets that compete hard for their business, one or two shopping malls, parks and other recreation facilities, a variety of health care facilities, friends and relatives, and many other potential destinations and activities. Even the densest cities in the world can’t provide that kind of variety and opportunity within 15 minutes on foot."

Labels: , , , , , , ,

Monday, November 01, 2021

What the Katy Managed Lanes tell us about the NHHIP 45N expansion project

This week we have a great guest post on the effectiveness of managed lanes and why they're so critical to the 45N expansion plan from Oscar Slotboom, author of Houston Freeways. (highlights mine)
---
Managed lanes are one of the more controversial features in the North Houston Highway Improvement Project. The current HOV lane uses 25 feet of width in the center of the existing freeway where there are no interior shoulders, and 41 feet of width where there are interior shoulders. In the NHHIP design, the managed lanes require 82 feet and the interior shoulders (with pylons) require 25 feet, for a total of 107 feet. So the extra width required for the managed lanes is 66 to 82 feet, which is about 37% of the needed new right-of-way north of Loop 610. The rest of the needed right-of-way is for buffers outside the frontage roads (27 feet on each side), wider frontage roads including a 15-foot-wide shared lane, more space between the main lanes and frontage roads, and auxiliary (merging) lanes for the main lanes.

The City of Houston proposal, which is endorsed by Harris County, would remove the managed lanes entirely and also remove the existing reversible HOV lane. Other opposition groups want more public transit emphasis and no right-of-way acquisition which would eliminate the managed lanes.

Of course, we already have a managed lane facility in Houston, the Katy Managed Lanes. Let's take a closer look at its performance, before and after Covid. Data sources: Metro and HCTRA.

Attention NNHIP Opposition: Managed lanes have demonstrated substantial transit ridership
In 2019, prior to Covid, Metro's bus routes using the Katy Managed Lanes served 9,105 weekday public transit trips, more than the $756 million Red Line north extension and the Green or Purple Lines, which together cost $1.4 billion. The original Red Line, which has strong ridership, had 42,385 weekday trips.

HOV and Ridesharing provide even more SOV reduction
Metro bus service is only part of the reduction in single-occupant vehicles provided by managed lanes. The main purpose of the Katy Managed Lanes, which require only 2 persons per vehicle for free use, is to promote carpooling and ridesharing. In contrast, most managed lanes facilities outside Houston require 3+ occupancy for free use, and privately owned managed lanes are operated to maximimize toll revenue. While there is no readily-available data for HOV traffic count, Metro's 2018 Highlights publication (p.28) states the following
"METRO provided 7.7 million Park & Ride commuter bus rides in 2017"
For all HOV/HOT lanes except the Katy Freeway managed lanes (which is operated by HCTRA), Metro reports
"An additional 25.4 million people used HOV/HOT lanes operated by Metro in 2017."
Even excluding the heavily-used Katy managed lanes, the ratio of HOV/HOT users to bus riders is 3.3 to 1. There's no information on the number of HOV vs. HOT vehicles, but the pre-covid Katy Managed Lanes bus ridership of 9,105 trips per day probably translates to HOV trips of at least 20,000 per weekday, which (assuming 2-person HOV) was taking at least 10,000 SOVs off the road.
Managed lanes serve vanpools, and Metro reports (for all its HOV lanes)
"METRO facilitated 2 million vanpool rides and more than 700 active vanpools in 2017."
The 2018 report also states
"HOV/HOT lanes maximize the utility and value of existing freeway lanes by allowing riders and vehicles to move faster and bypass heavy traffic."
That statement should put a smile on Tory's face, since his brand name for managed lanes is MaX lanes. (editor's note: It does! :-)
Impact of Covid
Metro's overall ridership dropped by around 55% for most months since April 2020. Park & ride customers are not transit dependent, so they could switch to their cars for safety, and they are mostly professional so many or most could work from home. Consequently, park & ride service was hit much worse, with Katy corridor ridership down around 88%.
Metro's downtown routes (221, 222, 228, 229) were down 95% in the year after Covid hit (excluding the uptick in recent months). However, ridership on Metro route 298, which provides service to the Texas Medical Center, was down only 53%, which is consistent with the overall loss in Metro ridership. Assuming route 298 riders don't have the option to work from home, this suggests that (95-53)/95 = 44% of the downtown route ridership loss was due to working from home. Of course, folks working from home will no longer be Metro customers in the future. Recovering these riders will depend on how many continue to work from home.

Revenue Generation
In 2019, the Katy Managed lanes generated $20.7 million in toll revenue, below its 2018 peak of $22.5 million. We can expect a rebound from the 2020 value of $8.9 million, but it may take years to get back to $20 million.
Managed lane toll revenue is low by HCTRA toll road standards, as HCTRA collected $855 million in toll revenue in 2019. The adjacent section of the Sam Houston Tollway to the south (to the Southwest Freeway) generated $116 million and the section to the north (to the Northwest Freeway) generated $98 million.
However, $21 million is substantial in the context of Metro's systemwide total farebox revenue, which was flat between 2013 and 2019 in the range of $72 million to $76 million, and was $75 million in 2019. Farebox collections for FY 2020, which ended in September with only 6 months affected by Covid, dropped to $43 million. Just completed FY 2021 (no data available yet) was fully affected by covid and will be much lower.
Metro's park & ride bus service also generates substantial farebox revenue due to its high fares. In the 15 months prior to Covid, the Grand Parkway endpoint was the most-used park & ride lot in the Metro system, averaging 2,977 daily trips. The fare for Grand Parkway service is $4.50, compared to $1.25 for regular service, which is diluted by discounts. Using an average fare of $4.25 for Metro park & ride service using the Katy Managed Lanes, we can estimate those routes generated 9105*52*5*4.25= $10.0 million in fares, which is 13% of 2019 Metro systemwide total farebox revenue. Adding together the toll and farebox revenue is $30.7 million, which is 41% of Metro's systemwide total farebox revenue.
dollar values in millions 2019
Toll Revenue $20.7
Bus Fares (estimated) $10.0
Katy Managed Lanes Total $30.7
Metro 2019 systemwide farebox revenue $75.3
Katy Managed Lanes revenue, percent of Metro systemwide farebox total 41%
Managed Lanes: more services provided = less risk of obsolescence
Suppose rail transit had been built instead of the managed lanes along the Katy Corridor. Rail would serve only commuters using public transit, and demand for that service was down 88%. Of course there will be a recovery, and there has been an uptick in recent months, but it remains to be seen how much of the lost ridership can be recovered. Due to work from home, demand for commuter transit will likely be suppressed indefinitely.
In today's money, rail infrastructure for the 19 miles from the Northwest Transit center at Loop 610 to the Grand Parkway would cost at least $1 billion for commuter-style trains, and at least $2 billion for light-rail style service. (Of course, the trains would have terminated at the Northwest transit center and required a transfer, which would lower ridership.) With the dramatic drop in commuter ridership, rail infrastructure would now be a very expensive and very underutilized asset.
Managed lanes provide multiple services, including ridersharing, vanpools, and express toll service. This lowers the risk of the investment. While these services were also down (toll revenue was down 57%), these services continued to be served, with toll users at a much higher level than commuter bus.
This underscores another major benefit of flexible, adaptable, and less expensive managed lanes. If consumer preferences shift, the lanes can easily adapt and won't become a costly "white elephant".
Managed Lanes: a crucial feature of NHHIP
To summarize
  • Pre-covid, the Katy Managed Lanes demonstrated strong transit ridership, higher than much more expensive recent light rail expansions.
  • Pre-covid, the Katy Managed Lanes demonstrated strong revenue generation, both tolls and bus farebox.
  • Ridesharing on managed lanes provides substantial SOV reduction, probably exceeding pre-covid transit.
  • With the onset of covid and the collapse of demand for commuter transit service, the Katy Managed Lanes continued to provide multiple services, underscoring its adaptability to shifting needs.
Managed lanes are the most important feature of NHHIP north of downtown, providing an adaptable transportation asset that will serve Houston's future needs, whatever they may be: bus rapid transit, commuter bus, HOV, vanpool, technologies of the future such as automated vehicles and potentially toll service. (Current plans don't include tolls, but would optimize the lanes for transit and ridesharing.)
Strong performance, low cost, and adaptability are reasons why Tory and I support the NHHIP managed lanes and are advocates of a managed lane network for Houston, as described in the MaX lanes report and as proposed in the TxDOT REAL plan.

Labels: , , , , , , , ,

Sunday, May 12, 2019

HTX tops for millennials, startups, and middle-class home affordability; Houspitality support, highway vs. rail cost-benefit

So a sad week here at Houston Strategies: I have a draft post where I keep ideas for future posts.  It had gotten quite long over the last 14 years, with tons of good thoughts and links whenever I had time to get to them.  Well, that all came to a crashing end last week when I discovered a Blogger quirk: if you open a post, paste in some content, realize it's not formatted right and accidentally hit Undo twice, it *wipes out the entire post* then auto-saves the blank version (and unlike Google Docs, Blogger does not keep a version history of posts).  Then I unwisely compounded the error trying to close the browser tab before the auto-save instead of just hitting the redo button.  Regardless, it's all gone now - 14 years of potential post ideas... 😳😢

Moving on to this week's items... lots of kudos for Houston this week!
"The region also has a reputation for welcoming newcomers, whether they’re from New York or New Zealand...a global city, with 90 consulates, two international airports, the second busiest seaport in the nation, and nearly 1,000 foreign-owned companies with HTX ops"
"Houston ranked among the top three cities in several specific areas, including diversity, ease of meeting new people, fair income taxes, everyday expenses, salary potential and amenities for children."
More details here, including some cool comparative graphs (hat tip to George). Houston is a pretty dominant #1, notably ahead of #2 Atlanta and #3 Dallas in the overall value graph (also notably ahead of #5 Austin!).
"In 2004, Denver-area voters approved a sale tax increase to pay for “FasTracks,” a plan to build 119 miles of rail transit lines in the metropolitan area. In 2008, California voters approved the sale of bonds to pay for the construction of a 520-mile high-speed rail line between Los Angeles/Anaheim and San Francisco/San Jose. FasTracks is within a metropolitan area and high-speed rail is supposed to connect several metropolitan areas, yet there are a lot of similarities between these two projects. 
Both rely on technologies that were rendered obsolete years before they received voter approval. The agencies sponsoring both projects ignored early warning signals that the projects were not cost effective. Both had large cost overruns. Advocates of both lied to voters about the benefits and costs of the projects. Due to poor planning, both projects remain incomplete. Despite the failure of the projects to date, both have adherents who hope to complete them."

Labels: , , , , , , , , , , ,

Sunday, August 12, 2018

METRONext 2040 Transit Plan Should be Affordable, Adaptable, and Designed for the Future

Today's guest post is from Houston Freeway's Oscar Slotboom as a followup to my recent post on the early draft MetroNext plan.
---
How can very limited available public transit funds be used to achieve maximum benefit for the Houston area? I suggest that the guiding principle should be designing for the future, not the past.

The Past

Light rail is very expensive and very slow, with new mileage likely to cost in the range of $150-200 million per mile. Commuter rail (expected to be under the authority of an agency other than Metro) is expensive and slow, costing at least $50 million per mile. Both are fixed, inflexible and usable only by trains.

Miles per hour Cost
Metro Red Line 13.6 $143 million/mile
Metro Green Line 12.3 Approx. $154 million/mile (2015)
Metro Purple Line 13.5 Approx. $154 million/mile
USA average light rail speed 15.8
USA average commuter rail speed 32
Houston 2015 commuter rail study
Cost Estimates
$48 million/mile outside the loop
$45-99 million/mile from Northwest Mall to downtown depending on route
Metro 222 Grand Parkway
Park and Ride
44
(to first stop downtown)
33
(to last stop)
Northwest Freeway Expansion, including 1 reversible HOV and the massive Loop 610 interchange
($2.5 billion for 38 miles, with $1.27 billion for construction)
$66 million per mile
Typical cost per lane of concrete: $6.5 million/mile
Equivalent cost of 2-lane BRT (pavement only, no stations or buses)
$13 million/mile

This table tells us three important facts
  • Concrete roadway is vastly less expensive than rail
  • The fastest transit service is achieved by bus-on-concrete express bus service with limited stops
  • Light rail is extremely slow, suitable only for short distance travel like 5 miles or less.
The Future: More Job Dispersion

HGAC projections show the percentage of jobs inside Loop 610 will drop to 16.6% by 2045.

Employment, millions (HGAC, January 2018)
2015 2045 Change
Region 3.2 100% 4.8 100%
Inside Loop 610 0.66 20.6% 0.79 16.6% -4.0
Loop-BW8 0.85 26.6% 1.34 28.2% +1.6
BW8-Grand Parkway 1.18 36.9% 1.82 38.2% +1.3
Outside Grand Parkway 0.51 15.9% 0.81 17.0% +1.1

This tells us that:
  • A downtown-centric mass transit system will serve a declining percentage of overall regional travel, and the need to serve so-called long and thin routes (i.e. routes with low ridership) to points outside downtown will increase.  
  • We don’t need more high capacity transit, but instead need more routes that can be affordably operated to more destinations with low rider counts at high service levels. 
  • Transit technologies of the past cannot affordably meet the future need.
Transportation of the Future is Taking Shape Today

While the future of autonomous vehicles and their impact remain speculative, recent reports detail impressive progress.
  • Google’s Waymo test program has logged more than 8 million miles of its vehicles driving in the fully autonomous mode in Phoenix, with around 400 people participating in the program for their daily transportation needs. An excerpt: (emphasis added)
"If self-driving cars make ride-hailing cheaper and more convenient, the research suggests, it could take a wrecking ball to public transportation. Strangely, the head of Phoenix’s public transportation agency agrees with that assessment.
'It will absolutely happen,' says Scott Smith, Valley Metro’s CEO. 'But I’m not scared, I’m excited. There will be a reduction in bus use, in subway use in some areas, but expanded use in others. This is real. We’ve got to be a part of it.'”
  • Wired reports on Phoenix's efforts to keep public transportation relevant with coming automated transportation services
  • Zoox (with impressive video report) is developing an all-electric robot taxi which is potentially highly suitable for transit service. The vehicle travels in both directions and can move sideways with its four-wheel steering. It is being tested in downtown San Francisco, and Zoox is among only three firms (along with Waymo and GM’s Cruise) that are currently known to be well-along in urban testing.
  • At least 6 other major efforts are in progress (see chart), which currently are reported to be less far along than Waymo, GM Cruise and Zoox.
Being Adaptable to Whatever the Future May Bring

While decentralization of employment is virtually certain in the future, the impact of new technology on public transit is unknown but could but be hugely disruptive, potentially substantially reducing demand for traditional public transit. 

That’s why we need a plan which is adaptable to whatever the future may bring.

For future planning purposes and MetroNext, it really does not matter if autonomous vehicles become available in 5 years or decades in the future. Anything built in the MetroNext plan can be expected to be in service to the year 2100 and beyond. MetroNext needs to be ready for autonomous transit, if and when it comes, but also maximize mobility benefits of transit investments if autonomous transit is slow to develop or has a minimal impact.

  • Scenario 1: A future with minimal influence of autonomous vehicles
In this case we need to serve dispersing employment with expanded service to more job centers at an affordable cost. Low-cost designs will maximize the number of these routes.
What we need: Concrete pavement for an expanded network of HOT lanes for buses and HOV
  • Scenario 2: A future where autonomous vehicles and traditional transit coexist, each serving different segments of the market
In this case we can envision traditional transit serving mainly a few high-volume destinations such as downtown, but most other transit will be served with public or private autonomous vehicles.
 
What we need: Transit facilities designed to be used by autonomous vehicles, as these vehicles may start on regular streets, then enter a dedicated transit guideway for a segment, then switch to a HOT lane, then return to regular streets
  • Scenario 3:  A future where autonomous transit vehicles are affordable and widely available, drastically lowering the demand for traditional public transit
In this case the focus of transportation agencies may totally change, perhaps with public transit agencies subsidizing fleets of autonomous vehicles to serve low-income communities, and perhaps shifting their focus to build and maintain autonomous vehicle guideways to provide premium high-speed service for robot transit taxis.
What we need: Transit investments that won’t go to waste when demand for traditional public transit collapses. We need transit facilities that are readily usable by autonomous vehicles and regular (non-transit) automobiles.
Implications for MetroNext

Metro could have as little as only $1 to $2.8 billion available for capital projects in the next 20 years. If new light rail costs $175 million per mile, that money could be burned up with only 6 to 16 miles of light rail. We can and must do much better.

The need for a transit system which is affordable, adaptable and ready for future leads to these conclusions and guiding principles:
  • Rail-based fixed guideways are totally useless for use by autonomous vehicles
  • Rail-based public transit, particularly light rail, is obscenely expensive and will likely suffer from low ridership, like we’re seeing on the Green and Purple lines
  • New rail mileage should be eliminated or minimized in MetroNext
  • Pavement-based transit is much less expensive to build than rail-based transit, is better-suited to serving future needs, and is adaptable to meet future autonomous vehicle needs
  • All new transit facilities should be pavement-based and designed to be used by autonomous transit vehicles. This may mean design features such as frequent entry/exit points, and through-lanes on bus rapid transit guideways at stations
  • MetroNext Plan B (or similar plan) should be adopted, since it is least expensive and most compatible with future needs and technology  
  • Due to Metro’s limited financial resources, Metro should partner with TxDOT to build key transit links in our future system. TxDOT will do the financial heavy lifting, minimizing the cost to Metro, but full political support from Metro and the City of Houston will be needed.
Partnerships with TxDOT

Click for full size

  • Interstate 10 Katy Freeway between the West Loop and downtown
Both Metro Plans A and B show BRT on this section. On the west end of this section are the existing Katy Managed Lanes, and on the east side new express lanes are planned as part of the downtown reconstruction project. These two sections of managed/express lanes need to be connected.
This section needs to be expanded, with four new MaX lanes and possibly a separate BRT as included in the Metro plans. I can envision a potential plan where the current westbound lanes are converted to MaX and BRT lanes, with new main lanes built on the north side.
  • Interstate 69 Southwest Freeway, Uptown/Gulfton area to downtown split
Metro’s plan A shows BRT on this corridor and plan B shows a “partnership project”. This section is currently under preliminary study by TxDOT, and this corridor should be widened to add four MaX lanes and potentially BRT.
  • West Loop
MetroNext has no new plans for this corridor, since the Post Oak bus lanes will open soon. TxDOT has proposed four express lanes on this corridor.
The express lanes should be designed to be usable by automated transit vehicles which need to pass through this congested area. This will involve connections at both ends, and possibly a third express lane in each direction for exclusive use by transit and automated vehicles.
Future Vision

MaX Lanes as proposed by Tory are ideally suited to provide the kind of service needed in the future. We can envision a future with buses, automated transit vehicles and HOV using regular streets, MaX lanes and dedicated transit guideways to serve a vastly expanded range of transit routes with high levels of service at speeds much faster than traditional transit.


Click for full size

Labels: , , , , , , ,

Monday, May 14, 2018

The genius of Houston deed restrictions, micro-transit solution to rail fail, tech to end traffic, top rankings and more

My featured item this week is another in Nolan Gray's excellent series at Market Urbanism on Houston's unique and free market land-use regulationThe Case for Subsidizing Deed Restrictions, which Houston does with a City legal department enforcing them.  Highly recommend reading the whole thing, but he ends with this great conclusion:
"This is the genius of Houston’s unique system: Let those with strong preferences for tight restrictions have them and the city as a whole can go on operating under a largely liberal land-use regime. There is a valuable lesson here for other cities: when attempting to liberalize land-use regulations, consider strengthening the private (subdivision deed restrictions) and public (stricter local rules subject to local consensus) mechanisms whereby the most powerful opponents of liberalization can simply opt out. Houston figured this out in 1965 and again deployed this strategy to great effect in the 1998 subdivision regulation overhaul. In relationships as in city planning, sometimes you have to give a little to get a little."
Hear hear! Moving on to this week's items:
"In the meantime think about this.  What could we have done instead with the $2.2 billion that was spent on light rail?  The answer is lots.  Like solving most of our flooding problem or resurfacing virtually every street in the street in the City or repairing our dilapidated wastewater system or putting more police officers on the streets or demolishing some of the thousands of dangerous buildings in the City or any one of dozens of other critical priorities facing the City. 
The question is not whether light rail is a good thing or not.  The question is whether it was the best use of $2.2 billion of taxpayer money.  The answer to that question is pretty clearly, “No.”
"According to the American Public Transportation Association, the average speed of rapid rail (a.k.a. heavy rail) is just 20 mph, while the average speed of rapid bus is less than 11 mph. 
According to the 2016 National Transit Database, the nation’s fastest heavy-rail line is BART, which averages 35 mph. Atlanta’s is 31 and Washington’s is 27, while New York City subways average just 18 mph. Considering that most transit riders also have to take time getting to and from transit stations, none of these can compete effectively with door-to-door driving, which in San Antonio averages 33 mph."
"For decades, cities have overseen transit monopolies that use heavy infrastructure, fixed routes and set schedules, under the premise that these will spur surrounding growth. And in many cities, they have. But thanks to the rise of the gig economy, workers often find themselves making multiple trips in a given day, and public transit has proven inflexible — unable to get them from point A to point B in a timely manner, or at all. As a result, even densifying cities have seen declining ridership. 
Contrast that with private transit, which has grown in success by pursuing “microtransit.” This model stresses malleable routes, on-demand service, smaller vehicles and minimal brick-and-mortar infrastructure. Companies include the bus services Via and Chariot; the ride-hailing services Uber and Lyft; and the bike-share services Zagster and LimeBike. Their flexibility lets them locate where demand exists, rather than counting on populations to come to them.
...
Indeed, these new microtransit companies could increase the flexibility of  transit, creating systems that are complicated yet smart, not orderly but dumb."
Finally, building on last week's post, it turns out that not only does Houston employ more people inside its city limits than larger city Chicago, it even employs more than much larger Los Angeles!  Reasons: I'd guess good annexation and multiple major job centers. Again hat tip and graphics credit to George.  Click to enlarge.


Labels: , , , , , , , , , , , ,

Thursday, March 15, 2018

My interview on Houston's transportation future, our traffic is better and housing more affordable than you think, and more

Apologies for going almost a month without a new post.  The big new item is my interview with KPRC Channel 2 on Houston’s transportation future that finally aired this week, promoting MaX Lanes of course.  I start at the 2:29 point after Kyle Shelton from the Kinder Institute at Rice. On camera is not my strength, but I think it came out ok.  Oddly, they also included a separate 5m video with my complete raw interview (including some stuff that honestly should be outtakes), but the benefit is it includes many more of my points, as awkward as it is.  It was quite loud next to the freeway, and they were yelling questions from a good distance away.  Kyle also has his 26m raw interview video where he makes some great points.

Ok, getting to the backlog of smaller items:
"Any rail system we build will not stop at the corner of McKinney and Main," said Metro board member Christof Spieler. "We are talking about a service that is better than commuter rail."
"Eventually, driverless cars are going to completely replace transit. Until that happens, it makes sense to only spend money on transit buses, which are inexpensive, flexible, can start new service tomorrow, and don’t require 30 years of debt payments. That’s a lesson most major American cities have yet to learn."
"You Can Build Your Way out of Congestion 
Los Angeles is still the most congested urban area in the world, according to the latest INRIX traffic scorecard. However, what is more interesting is that congestion seems to be declining in several fast-growing cities in Texas, thanks to construction of new highways
Dallas is twice as big as Seattle and Houston is three times as big. The Dallas and Houston urban areas are both growing nearly twice as fast as Seattle’s, but Seattle is concentrating its growth in the city while Dallas and Houston allow more people to settle in the suburbs. INRIX found that congestion was worse in Seattle than either Dallas or Houston, which was a direct result of Washington’s growth-management policies. 
Moreover, while INRIX’s congestion index for Seattle — and most other cities — grew worse since last year’s scorecard, the congestion indices for Dallas, Houston, Austin, San Antonio, and El Paso all improved."
              That's enough for this week - more next.

              Labels: , , , , , , , , , , ,

              Monday, February 19, 2018

              Two choices for Houston's transit future (Chronicle op-ed)

              The Houston Chronicle featured my op-ed as the lead in their Sunday edition Opinion section yesterday.  Since I've had problems with the reliability of the Chronicle archives in the past (especially after a few years pass), I've included the full text below.  Looking forward to your thoughts in the comments!

              Two choices for Houston’s transit future

              As both H-GAC and Metro prepare new long-term transit plans, Houston is facing a critical decision point between two paths that will determine our transportation future for decades to come – and whether we continue to thrive and grow as a global city or we become another gridlocked, unaffordable LA.

              The first path - sometimes called for by local officials - is the traditional approach of adding rail as cities grow beyond a certain size, with New York, Washington DC, Chicago, and San Francisco being the largest examples.  This is not only extremely expensive to build – New York is spending $2.7 billion per mile on the Second Avenue Subway – but expensive to maintain, with massive maintenance backlogs causing well-publicized chronic service problems in New York, Washington DC, and San Francisco. Even worse, it turns out adding rail to sprawling Sunbelt cities built in the automobile age has been a costly failure almost everywhere, including recent bad press on Dallas DART’s high costs and low ridership, Denver’s $4.7 billion FasTracks, and LA’s $9 billion rail investment leading to overall transit ridership declines If LA - with twice our density, far worse traffic congestion, and perfect walking/waiting weather - can’t make massive rail investments pay off, what chance does Houston have?

              Beyond these issues, traditional transit is facing the same technological disruption as many other industries with the imminent arrival of autonomous vehicles.  Shared ride services like Uber and Lyft are already causing broad transit ridership declines across the country, and estimates are that their prices could drop even further to $0.35/mile once they go autonomous in the 2020s. Despite the high risk of building obsolete and costly white elephants with taxpayer dollars, some cities continue to plunge obliviously into this technological buzz saw with obscenely expensive old-school rail plans like $54 billion in Seattle, $5.2 billion in Nashville, and $10+ billion in Honolulu ($10,500 per Oahu resident!).  And we’re not immune to the insanity: some of the rail plans under consideration for Houston could easily run into several tens of billions of dollars.

              So what’s a second path that rides this disruptive technological wave rather than drowns under it? There are hints of it in the Chronicle’s recent coverage of Metro’s commuter bus expansions and the Downtown Management District’s ‘Metro MAX’ proposal of two-way HOV-lane bus service connecting more than a dozen major job centers.  Houston is a dispersed city with many major job centers besides Downtown – like Uptown, the Texas Medical Center, Greenway, Energy Corridor, Westchase, Memorial City, etc. - needing commuter services that would be poorly served by a downtown-centric rail network feeding less than 7% of the area’s jobs.

              Taking it to the next level would be our proposal of an expanded network of two-way Managed eXpress (MaX) freeway lanes connecting every job center to every neighborhood.  These lanes would be explicitly managed to move the maximum number of people at maximum speed, including converting to autonomous-only when the technology becomes available.  At that point, vehicles can run safely at much higher speeds while platooning more closely together to increase capacity. These lanes are far more cost-effective and flexible than rail, and we estimate that such a network could support a million commuters to a million jobs Houston’s core job centers – more core jobs than any other city in the country outside of Manhattan.

              But what’s the experience like for the actual commuter?  With rail, it’s infrequent service (big capacity = longer waits to fill) with many intermediate stops, averaging 25-35 mph dropping you far from your workplace and requiring time-consuming walks or transfers in all sorts of weather.  With MaX Lanes you may be in a comfortable public or private Park-and-Ride bus or a smaller shared commuter vehicle that picks you up along with others in your neighborhood going to the same job center (such custom vehicles may even have private compartments).  As they enter the MaX Lanes, they go into autonomous “auto-pilot” mode (if they’re not already) and accelerate to high speeds – possibly as high as 100+mph! (can you imagine the global publicity for Houston and our image if we’re the first city on the planet to offer affordable 100+mph daily commuter services?!)  They then go nonstop to your job center wherever it may be, where they exit and circulate to get you right to your building – no transfers and no risk of walking or waiting in summer heat or downpours.  A faster, better experience at a far lower cost – it’s no contest.

              Historically, Houston has always been comfortable ignoring the conventional wisdom and going our own pragmatic way - like being the largest city in the country without zoning and building an extensive HOV/HOT bus lane network instead of costly, inflexible, and slow commuter rail.  We should continue that iconoclastic tradition and publicly embrace the next generation of transit instead of chasing flashy, over-priced, ineffective rail projects like other cities (and put the savings towards flood control!).

              Two paths forward – one looking to the past and one looking to the future. The choice is ours.

              Tory Gattis is a Founding Senior Fellow with the Center for Opportunity Urbanism and writes the Houston Strategies blog.  His report on MaX Lanes for Houston can be found here.

              Labels: , , , , , , , , ,